Wells Fargo 2009 Annual Report Download - page 183
Download and view the complete annual report
Please find page 183 of the 2009 Wells Fargo annual report below. You can navigate through the pages in the report by either clicking on the pages listed below, or by using the keyword search tool below to find specific information within the annual report.-
 1
1 -
2
-
3
-
4
-
5
-
6
-
7
-
8
-
9
-
10
-
11
-
12
-
13
-
14
-
15
-
16
-
17
-
18
-
19
-
20
-
21
-
22
-
23
-
24
-
25
-
26
-
27
-
28
-
29
-
30
-
31
-
32
-
33
-
34
-
35
-
36
-
37
-
38
-
39
-
40
-
41
-
42
-
43
-
44
-
45
-
46
-
47
-
48
-
49
-
50
-
51
-
52
-
53
-
54
-
55
-
56
-
57
-
58
-
59
-
60
-
61
-
62
-
63
-
64
-
65
-
66
-
67
-
68
-
69
-
70
-
71
-
72
-
73
-
74
-
75
-
76
-
77
-
78
-
79
-
80
-
81
-
82
-
83
-
84
-
85
-
86
-
87
-
88
-
89
-
90
-
91
-
92
-
93
-
94
-
95
-
96
-
97
-
98
-
99
-
100
-
101
-
102
-
103
-
104
-
105
-
106
-
107
-
108
-
109
-
110
-
111
-
112
-
113
-
114
-
115
-
116
-
117
-
118
-
119
-
120
-
121
-
122
-
123
-
124
-
125
-
126
-
127
-
128
-
129
-
130
-
131
-
132
-
133
-
134
-
135
-
136
-
137
-
138
-
139
-
140
-
141
-
142
-
143
-
144
-
145
-
146
-
147
-
148
-
149
-
150
-
151
-
152
-
153
-
154
-
155
-
156
-
157
-
158
-
159
-
160
-
161
-
162
-
163
-
164
-
165
-
166
-
167
-
168
-
169
-
170
-
171
-
172
-
 173
173 -
 174
174 -
 175
175 -
 176
176 -
 177
177 -
 178
178 -
 179
179 -
 180
180 -
 181
181 -
 182
182 -
 183
183 -
 184
184 -
 185
185 -
 186
186 -
 187
187 -
 188
188 -
 189
189 -
 190
190 -
 191
191 -
 192
192 -
 193
193 -
194
-
195
-
196
 |
 |

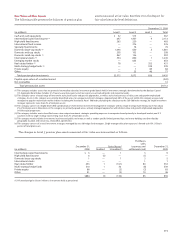
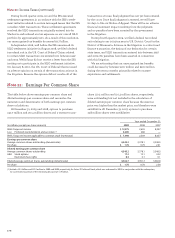
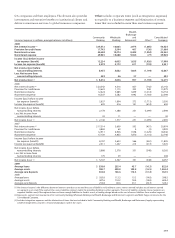
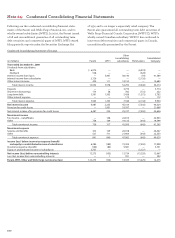
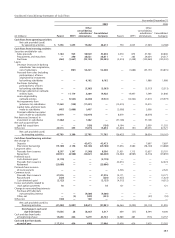
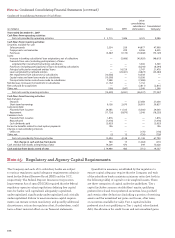
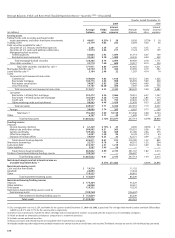
Condensed Consolidating Statements of Income
Other
consolidating Consolidated
(in millions) Parent WFFI subsidiaries Eliminations Company
Year ended December 31, 2008
Dividends from subsidiaries:
Bank $1,806 — — (1,806) —
Nonbank 326 — — (326) —
Interest income from loans 2 5,275 22,417 (62) 27,632
Interest income from subsidiaries 2,892 — — (2,892) —
Other interest income 241 108 7,051 (134) 7,266
Total interest income 5,267 5,383 29,468 (5,220) 34,898
Deposits — — 4,966 (445) 4,521
Short-term borrowings 475 220 1,757 (974) 1,478
Long-term debt 2,957 1,807 661 (1,669) 3,756
Total interest expense 3,432 2,027 7,384 (3,088) 9,755
Net interest income 1,835 3,356 22,084 (2,132) 25,143
Provision for credit losses — 2,970 13,009 — 15,979
Net interest income after provision for credit losses 1,835 386 9,075 (2,132) 9,164
Noninterest income
Fee income – nonaffiliates — 437 10,110 — 10,547
Other (101) 168 8,181 (2,061) 6,187
Total noninterest income (101) 605 18,291 (2,061) 16,734
Noninterest expense
Salaries and benefits (385) 719 12,606 — 12,940
Other 15 1,119 10,585 (2,061) 9,658
Total noninterest expense (370) 1,838 23,191 (2,061) 22,598
Income (loss) before income tax expense (benefit)
and equity in undistributed income of subsidiaries 2,104 (847) 4,175 (2,132) 3,300
Income tax expense (benefit) (83) (289) 974 — 602
Equity in undistributed income of subsidiaries 468 — — (468) —
Net income (loss) before noncontrolling interests 2,655 (558) 3,201 (2,600) 2,698
Less: Net income from noncontrolling interests — — 43 — 43
Parent, WFFI, Other and Wells Fargo net income (loss) $2,655 (558) 3,158 (2,600) 2,655
Year ended December 31, 2007
Dividends from subsidiaries:
Bank $4,587 — — (4,587) —
Nonbank 398 — — (398) —
Interest income from loans — 5,643 23,453 (56) 29,040
Interest income from subsidiaries 3,693 — — (3,693) —
Other interest income 152 115 5,875 (5) 6,137
Total interest income 8,830 5,758 29,328 (8,739) 35,177
Deposits — — 8,793 (641) 8,152
Short-term borrowings 444 442 1,626 (1,267) 1,245
Long-term debt 3,830 1,923 900 (1,847) 4,806
Total interest expense 4,274 2,365 11,319 (3,755) 14,203
Net interest income 4,556 3,393 18,009 (4,984) 20,974
Provision for credit losses — 969 3,970 — 4,939
Net interest income after provision for credit losses 4,556 2,424 14,039 (4,984) 16,035
Noninterest income
Fee income – nonaffiliates — 394 10,233 — 10,627
Other 117 140 9,190 (1,528) 7,919
Total noninterest income 117 534 19,423 (1,528) 18,546
Noninterest expense
Salaries and benefits 61 1,229 12,078 — 13,368
Other 291 1,119 9,495 (1,527) 9,378
Total noninterest expense 352 2,348 21,573 (1,527) 22,746
Income (loss) before income tax expense (benefit)
and equity in undistributed income of subsidiaries 4,321 610 11,889 (4,985) 11,835
Income tax expense (benefit) (257) 246 3,581 — 3,570
Equity in undistributed income of subsidiaries 3,479 — — (3,479) —
Net income (loss) before noncontrolling interests 8,057 364 8,308 (8,464) 8,265
Less: Net income from noncontrolling interests — — 208 — 208
Parent, WFFI, Other and Wells Fargo net income (loss) $8,057 364 8,100 (8,464) 8,057