Wells Fargo 2009 Annual Report Download - page 174
Download and view the complete annual report
Please find page 174 of the 2009 Wells Fargo annual report below. You can navigate through the pages in the report by either clicking on the pages listed below, or by using the keyword search tool below to find specific information within the annual report.-
 1
1 -
2
-
3
-
4
-
5
-
6
-
7
-
8
-
9
-
10
-
11
-
12
-
13
-
14
-
15
-
16
-
17
-
18
-
19
-
20
-
21
-
22
-
23
-
24
-
25
-
26
-
27
-
28
-
29
-
30
-
31
-
32
-
33
-
34
-
35
-
36
-
37
-
38
-
39
-
40
-
41
-
42
-
43
-
44
-
45
-
46
-
47
-
48
-
49
-
50
-
51
-
52
-
53
-
54
-
55
-
56
-
57
-
58
-
59
-
60
-
61
-
62
-
63
-
64
-
65
-
66
-
67
-
68
-
69
-
70
-
71
-
72
-
73
-
74
-
75
-
76
-
77
-
78
-
79
-
80
-
81
-
82
-
83
-
84
-
85
-
86
-
87
-
88
-
89
-
90
-
91
-
92
-
93
-
94
-
95
-
96
-
97
-
98
-
99
-
100
-
101
-
102
-
103
-
104
-
105
-
106
-
107
-
108
-
109
-
110
-
111
-
112
-
113
-
114
-
115
-
116
-
117
-
118
-
119
-
120
-
121
-
122
-
123
-
124
-
125
-
126
-
127
-
128
-
129
-
130
-
131
-
132
-
133
-
134
-
135
-
136
-
137
-
138
-
139
-
140
-
141
-
142
-
143
-
144
-
145
-
146
-
147
-
148
-
149
-
150
-
151
-
152
-
153
-
154
-
155
-
156
-
157
-
158
-
159
-
160
-
161
-
162
-
163
-
 164
164 -
 165
165 -
 166
166 -
 167
167 -
 168
168 -
 169
169 -
 170
170 -
 171
171 -
 172
172 -
 173
173 -
 174
174 -
 175
175 -
 176
176 -
 177
177 -
 178
178 -
 179
179 -
 180
180 -
 181
181 -
 182
182 -
 183
183 -
 184
184 -
185
-
186
-
187
-
188
-
189
-
190
-
191
-
192
-
193
-
194
-
195
-
196
 |
 |

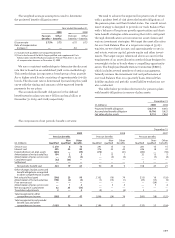
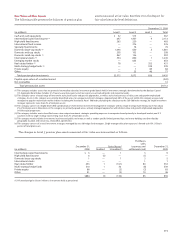
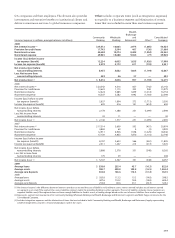
Other benefits plan assets include assets held in a 401(h)
trust, which are invested using the same asset allocation
targets as the Cash Balance Plan, and assets held in a VEBA
trust. The table below presents the balances of other benefits
plan assets measured at fair value.
December 31, 2009
(in millions) Level 1Level 2Level 3 Total
Cash and cash equivalents $ 2 38 — 40
Intermediate (core) fixed income (1) 21 83 — 104
High-yield fixed income 84—12
International fixed income — 3 — 3
Specialty fixed income —2—2
Domestic large-cap stocks (2) 40 30 — 70
Domestic mid-cap stocks 716—23
Domestic small-cap stocks 18 16 — 34
International stocks (3) 11 39 — 50
Emerging market stocks —14—14
Real estate/timber 2— 4 6
Multi-strategy hedge funds — — 5 5
Private equity —— 2 2
Other — — 21 21
Total other benefits plan investments $109 245 32 386
Payable upon return of securities loaned (10)
Total other benefits plan assets $376
(1) This category includes assets that are primarily intermediate duration, investment grade bonds held in investment strategies benchmarked to the Barclays Capital
U.S. Aggregate Bond Index. Includes U.S. Treasury securities, agency and non-agency asset-backed bonds and corporate bonds.
(2) This category covers a broad range of investment styles, both active and passive approaches, as well as style characteristics of value, core and growth emphasized
strategies. The majority of the assets are passively managed to popular mainstream market indexes including the Standard & Poor’s 500 Index.
(3) This category includes assets diversified across several unique investment strategies providing exposure to companies based primarily in developed market,
non-U.S. countries.
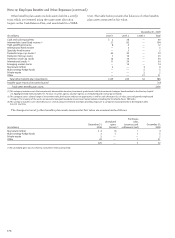
Note 19: Employee Benefits and Other Expenses (continued)
Purchases,
Unrealized sales,
December 31, gains issuances and December 31,
(in millions) 2008 (losses)(1) settlements (net) 2009
Real estate/timber $ 4 (1) 1 4
Multi-strategy hedge funds 3 1 1 5
Private equity 2— — 2
Other 20 — 1 21
$29 — 3 32
(1) All unrealized gains (losses) relate to instruments held at period end.
The changes in Level 3 other benefits plan assets measured at fair value are summarized as follows: