Wells Fargo 2009 Annual Report Download - page 36
Download and view the complete annual report
Please find page 36 of the 2009 Wells Fargo annual report below. You can navigate through the pages in the report by either clicking on the pages listed below, or by using the keyword search tool below to find specific information within the annual report.
Wells Fargo & Company is a $1.2 trillion diversified financial
services company providing banking, insurance, trust and
investments, mortgage banking, investment banking, retail
banking, brokerage and consumer finance through banking
stores, the internet and other distribution channels to individ-
uals, businesses and institutions in all 50 states, the District
of Columbia (D.C.) and in other countries. We ranked fourth
in assets and second in the market value of our common stock
among our peers at December 31, 2009. When we refer to
“Wells Fargo,” “the Company,” “we,” “our” or “us” in this
Report, we mean Wells Fargo & Company and Subsidiaries
(consolidated). When we refer to the “Parent,” we mean
Wells Fargo & Company. When we refer to “legacy
Wells Fargo,” we mean Wells Fargo excluding
Wachovia Corporation (Wachovia).
Our vision is to satisfy all our customers’ financial needs,
help them succeed financially, be recognized as the premier
financial services company in our markets and be one of
America’s great companies. Our primary strategy to achieve
this vision is to increase the number of products our customers
buy from us and to give them all of the financial products that
fulfill their needs. Our cross-sell strategy, diversified business
model and the breadth of our geographic reach facilitate growth
in both strong and weak economic cycles, as we can grow by
expanding the number of products our current customers have
with us, gain new customers in our extended markets, and
increase market share in many businesses. We continued to earn
more of our customers’ business in 2009 in both our retail and
commercial banking businesses and in our equally customer-
centric securities brokerage and investment banking businesses.
On December 31, 2008, Wells Fargo acquired Wachovia.
Because the acquisition was completed at the end of 2008,
Wachovia’s results are included in the income statement,
average balances and related financial information beginning
in 2009. Wachovia’s assets and liabilities are included, at
fair value, in the consolidated balance sheet beginning on
December 31, 2008, but not in 2008 averages.
On January 1, 2009, we adopted new FASB guidance on
noncontrolling interests on a retrospective basis for disclosure
and, accordingly, prior period information reflects the adoption.
The guidance requires that noncontrolling interests be reported
as a component of total equity. In addition, our consolidated
income statement must disclose amounts attributable to both
Wells Fargo interests and the noncontrolling interests.
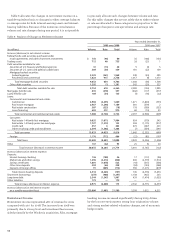
We generated record revenue and built capital at a record
rate in 2009 despite elevated credit costs. Wells Fargo net
income was a record $12.3 billion in 2009, with net income
applicable to common stock of $8.0 billion. Diluted earnings
per common share were $1.75. In fourth quarter 2009, we fully
repaid the U.S. Treasury’s $25 billion Troubled Asset Relief
Program (TARP) Capital Purchase Program (CPP) preferred
stock investment, including related preferred dividends, which
reduced 2009 diluted earnings per share by $0.76 per share.
Pre-tax pre-provision profit (PTPP) was $39.7 billion in 2009,
which covered more than 2.1 times annual net charge-offs.
PTPP is total revenue less noninterest expense. Management
believes that PTPP is a useful financial measure because it
enables investors and others to assess the Company’s ability
to generate capital to cover credit losses through a credit cycle.
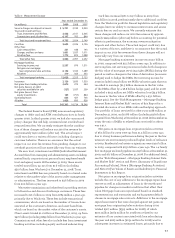
Our cross-sell at legacy Wells Fargo set records for the
11th consecutive year with a record of 5.95 Wells Fargo products
for retail banking households. Our goal is eight products
per customer, which is approximately half of our estimate of
potential demand. One of every four of our legacy Wells Fargo
retail banking households has eight or more products and our
average middle-market commercial banking customer has
almost eight products. Wachovia retail bank households had
an average of 4.65 Wachovia products. We believe there is
potentially significant opportunity for growth as we increase
the Wachovia retail bank household cross-sell. For legacy
Wells Fargo, our average middle-market commercial banking
customer reached an average of 7.8 products and an average
of 6.4 products for Wholesale Banking customers. Business
banking cross-sell offers another potential opportunity for
growth, with a record cross-sell of 3.77 products at legacy
Wells Fargo.
Wells Fargo remained one of the largest providers of credit
to the U.S. economy. We continued to lend to credit-worthy
customers and, during 2009, made $711 billion in new loan
commitments to consumer, small business and commercial
customers, including $420 billion of residential mortgage
originations. We are an industry leader in loan modifications
for homeowners. As of December 31, 2009, nearly half a million
Wells Fargo mortgage customers were in active trial or had
completed loan modifications started in the prior 12 months.
We have helped reduce mortgage payments for 1.7 million
homeowners through refinancing.
Overview
This Annual Report, including the Financial Review and the Financial Statements and related Notes, has forward-looking statements,
which may include forecasts of our financial results and condition, expectations for our operations and business, and our assumptions
for those forecasts and expectations. Do not unduly rely on forward-looking statements. Actual results may differ materially from our
forward-looking statements due to several factors. Some of these factors are described in the Financial Review and in the Financial
Statements and related Notes. For a discussion of other factors, refer to the “Risk Factors” section in this Report. A Glossary of
Acronyms for terms used throughout this Report and a Codification Cross Reference for cross references from accounting standards
under the recently adopted Financial Accounting Standards Board (FASB) Accounting Standards Codification (Codification)
to pre-Codification accounting standards can be found at the end of this Report.
Financial Review


