Wells Fargo 2009 Annual Report Download - page 53
Download and view the complete annual report
Please find page 53 of the 2009 Wells Fargo annual report below. You can navigate through the pages in the report by either clicking on the pages listed below, or by using the keyword search tool below to find specific information within the annual report.-
 1
1 -
2
-
3
-
4
-
5
-
6
-
7
-
8
-
9
-
10
-
11
-
12
-
13
-
14
-
15
-
16
-
17
-
18
-
19
-
20
-
21
-
22
-
23
-
24
-
25
-
26
-
27
-
28
-
29
-
30
-
31
-
32
-
33
-
34
-
35
-
36
-
37
-
38
-
39
-
40
-
41
-
42
-
 43
43 -
 44
44 -
 45
45 -
 46
46 -
 47
47 -
 48
48 -
 49
49 -
 50
50 -
 51
51 -
 52
52 -
 53
53 -
 54
54 -
 55
55 -
 56
56 -
 57
57 -
 58
58 -
 59
59 -
 60
60 -
 61
61 -
 62
62 -
 63
63 -
64
-
65
-
66
-
67
-
68
-
69
-
70
-
71
-
72
-
73
-
74
-
75
-
76
-
77
-
78
-
79
-
80
-
81
-
82
-
83
-
84
-
85
-
86
-
87
-
88
-
89
-
90
-
91
-
92
-
93
-
94
-
95
-
96
-
97
-
98
-
99
-
100
-
101
-
102
-
103
-
104
-
105
-
106
-
107
-
108
-
109
-
110
-
111
-
112
-
113
-
114
-
115
-
116
-
117
-
118
-
119
-
120
-
121
-
122
-
123
-
124
-
125
-
126
-
127
-
128
-
129
-
130
-
131
-
132
-
133
-
134
-
135
-
136
-
137
-
138
-
139
-
140
-
141
-
142
-
143
-
144
-
145
-
146
-
147
-
148
-
149
-
150
-
151
-
152
-
153
-
154
-
155
-
156
-
157
-
158
-
159
-
160
-
161
-
162
-
163
-
164
-
165
-
166
-
167
-
168
-
169
-
170
-
171
-
172
-
173
-
174
-
175
-
176
-
177
-
178
-
179
-
180
-
181
-
182
-
183
-
184
-
185
-
186
-
187
-
188
-
189
-
190
-
191
-
192
-
193
-
194
-
195
-
196
 |
 |

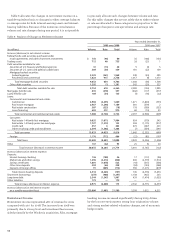
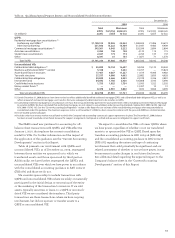
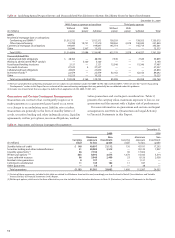
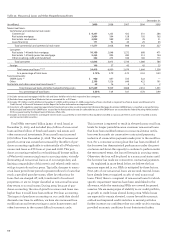
Table 15: Qualifying Special Purpose Entities and Unconsolidated Variable Interest Entities
December 31,
2009 2008
Total Maximum Total Maximum
entity Carrying exposure entity Carrying exposure
(in millions) assets value to loss assets value to loss
QSPEs
Residential mortgage loan securitizations (1):
Conforming and GNMA (2) $1,150,515 18,926 24,362 1,008,824 21,496 24,619
Other/nonconforming 251,850 13,222 13,469 313,447 9,483 9,909
Commercial mortgage securitizations (1) 345,561 4,945 5,222 320,299 2,894 2,894
Auto loan securitizations 2,285 158 158 4,133 115 115
Student loan securitizations 2,637 173 173 2,765 133 133
Other 8,391 61 135 11,877 71 1,576
Total QSPEs $1,761,239 37,485 43,519 1,661,345 34,192 39,246
Unconsolidated VIEs
Collateralized debt obligations (1) $ 55,899 14,734 16,607 54,294 15,133 20,443
Wachovia administered ABCP (3) conduit 5,160 — 5,263 10,767 — 15,824
Asset-based finance structures 17,467 9,867 11,227 11,614 9,096 9,482
Tax credit structures 27,537 4,006 4,663 22,882 3,850 4,926
Collateralized loan obligations 23,830 3,666 4,239 23,339 3,326 3,881
Investment funds 84,642 1,702 2,920 105,808 3,543 3,690
Credit-linked note structures 1,755 1,025 1,754 12,993 1,522 2,303
Money market funds (4) ——— 13,307 10 51
Other 8,470 2,981 5,048 1,832 3,806 4,699
Total unconsolidated VIEs $ 224,760 37,981 51,721 256,836 40,286 65,299
(1) Certain December 31, 2008, balances have been revised to reflect additionally identified residential mortgage QSPEs and collateralized debt obligation VIEs, as well as to
reflect removal of commercial mortgage asset transfers that were subsequently determined not to be transfers to QSPEs.
(2) Conforming residential mortgage loan securitizations are those that are guaranteed by government-sponsored entities (GSEs), including Government National Mortgage
Association (GNMA). We have concluded that conforming mortgages are not subject to consolidation under Accounting Standards Update (ASU) 2009-16 (FAS 166) and
ASU 2009-17 (FAS 167). See the “Current Accounting Developments” section in this Report for our estimate of the nonconforming mortgages that may potentially be
consolidated under this guidance. The maximum exposure to loss as of December 31, 2008, has been revised to conform with the year-end 2009 basis of determination.
(3) Asset-backed commercial paper.
(4) Includes only those money market mutual funds to which the Company had outstanding contractual support agreements in place. The December 31, 2008, balance
has been revised to exclude certain funds because the support arrangements had lapsed or settled and we were not obligated to support such funds.
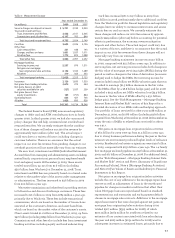
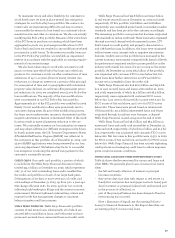
The FASB issued new guidance for accounting for off-
balance sheet transactions with QSPEs and VIEs effective
January 1, 2010, that replaces the current consolidation
model for VIEs. For further information and the impact of
the application of this guidance, see the “Current Accounting
Developments” section in this Report.
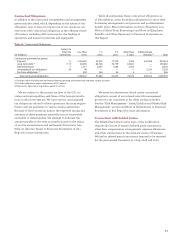
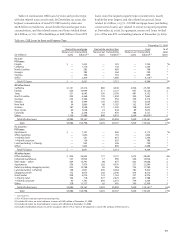
Table 16 presents our involvement with QSPEs and
unconsolidated VIEs as of December 31, 2009, segregated
between those entities we sponsored or to which we
transferred assets and those sponsored by third parties.
Additionally, we have further segregated the QSPEs and
unconsolidated VIEs over which we have power in accordance
with the consolidated accounting guidance in ASU 2009-17
(FAS 167) and those we do not.
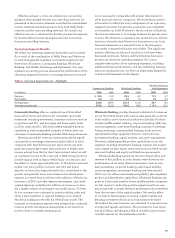
We consider sponsorship to include transactions with
QSPEs and unconsolidated VIEs where we solely or materially
participated in the initial design or structuring of the entity
or the marketing of the transaction to investors. If we sold
assets, typically securities or loans, to a QSPE or unconsoli-
dated VIE we are considered the transferor. Third party
transactions are those transactions where we have ongoing
involvement, but did not sponsor or transfer assets to a
QSPE or unconsolidated VIE.
We expect to consolidate the VIEs or former QSPEs where
we have power, regardless of whether or not we transferred
assets to or sponsored the VIE or QSPE. Based upon the
transfers accounting guidance in ASU 2009-16 (FAS 166)
and the consolidated accounting guidance in ASU 2009-17
(FAS 167) regarding the nature and type of continuing
involvement that could potentially be significant and our
related assessment of whether or not we have power, it may
be necessary to make changes in our future disclosures.
See additional detail regarding the expected impact to the
Company’s balance sheet in the “Current Accounting
Developments” section of this Report.