Wells Fargo 2009 Annual Report Download - page 125
Download and view the complete annual report
Please find page 125 of the 2009 Wells Fargo annual report below. You can navigate through the pages in the report by either clicking on the pages listed below, or by using the keyword search tool below to find specific information within the annual report.-
 1
1 -
2
-
3
-
4
-
5
-
6
-
7
-
8
-
9
-
10
-
11
-
12
-
13
-
14
-
15
-
16
-
17
-
18
-
19
-
20
-
21
-
22
-
23
-
24
-
25
-
26
-
27
-
28
-
29
-
30
-
31
-
32
-
33
-
34
-
35
-
36
-
37
-
38
-
39
-
40
-
41
-
42
-
43
-
44
-
45
-
46
-
47
-
48
-
49
-
50
-
51
-
52
-
53
-
54
-
55
-
56
-
57
-
58
-
59
-
60
-
61
-
62
-
63
-
64
-
65
-
66
-
67
-
68
-
69
-
70
-
71
-
72
-
73
-
74
-
75
-
76
-
77
-
78
-
79
-
80
-
81
-
82
-
83
-
84
-
85
-
86
-
87
-
88
-
89
-
90
-
91
-
92
-
93
-
94
-
95
-
96
-
97
-
98
-
99
-
100
-
101
-
102
-
103
-
104
-
105
-
106
-
107
-
108
-
109
-
110
-
111
-
112
-
113
-
114
-
 115
115 -
 116
116 -
 117
117 -
 118
118 -
 119
119 -
 120
120 -
 121
121 -
 122
122 -
 123
123 -
 124
124 -
 125
125 -
 126
126 -
 127
127 -
 128
128 -
 129
129 -
 130
130 -
 131
131 -
 132
132 -
 133
133 -
 134
134 -
 135
135 -
136
-
137
-
138
-
139
-
140
-
141
-
142
-
143
-
144
-
145
-
146
-
147
-
148
-
149
-
150
-
151
-
152
-
153
-
154
-
155
-
156
-
157
-
158
-
159
-
160
-
161
-
162
-
163
-
164
-
165
-
166
-
167
-
168
-
169
-
170
-
171
-
172
-
173
-
174
-
175
-
176
-
177
-
178
-
179
-
180
-
181
-
182
-
183
-
184
-
185
-
186
-
187
-
188
-
189
-
190
-
191
-
192
-
193
-
194
-
195
-
196
 |
 |

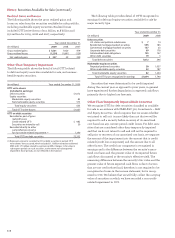
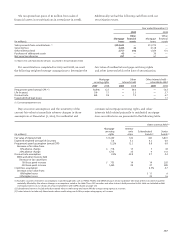
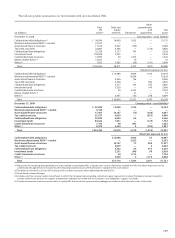
Year ended December 31,
(in millions) 2009 2008 2007
Net gains (losses) from:
Private equity investments (1) $(368) 265 598
Principal investments 79 ——
All other nonmarketable
equity investments (234) (10) 4
Net gains (losses) from
nonmarketable equity
investments $(523) 255 602
(1) Net gains in 2008 include $334 million gain from our ownership in Visa,
which completed its initial public offering in March 2008.
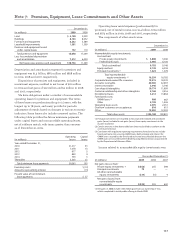
Note 7: Premises, Equipment, Lease Commitments and Other Assets
Operating lease rental expense (predominantly for
premises), net of rental income, was $1.4 billion, $709 million
and $673 million in 2009, 2008 and 2007, respectively.
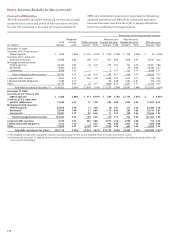
The components of other assets were:
Depreciation and amortization expense for premises and
equipment was $1.3 billion, $861 million and $828 million
in 2009, 2008 and 2007, respectively.
Dispositions of premises and equipment, included in
noninterest expense, resulted in net losses of $22 million
in 2009 and net gains of $22 million and $3 million in 2008
and 2007, respectively.
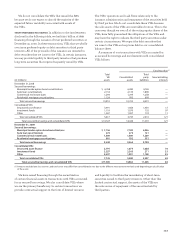
We have obligations under a number of noncancelable
operating leases for premises and equipment. The terms
of these leases are predominantly up to 15 years, with the
longest up to 78 years, and many provide for periodic
adjustment of rentals based on changes in various economic
indicators. Some leases also include a renewal option. The
following table provides the future minimum payments
under capital leases and noncancelable operating leases,
net of sublease rentals, with terms greater than one year
as of December 31, 2009.
Income related to nonmarketable equity investments was:
December 31,
(in millions) 2009 2008
Land $ 2,140 2,029
Buildings 8,143 8,232
Furniture and equipment 6,232 5,589
Leasehold improvements 1,381 1,309
Premises and equipment leased
under capital leases 152 110
Total premises and equipment 18,048 17,269
Less: Accumulated depreciation
and amortization 7,312 6,000
Net book value, premises and equipment $10,736 11,269
Operating Capital
(in millions) leases leases
Year ended December 31,
2010 $1,217 53
2011 1,078 13
2012 977 5
2013 849 4
2014 739 3
Thereafter 3,503 25
Total minimum lease payments $8,363 103
Executory costs $ (13)
Amounts representing interest (13)
Present value of net minimum
lease payments $ 77
December 31,
(in millions) 2009 2008
Nonmarketable equity investments:
Cost method:
Private equity investments $ 3,808 3,040
Federal bank stock 5,985 6,106
Total cost method 9,793 9,146
Equity method 5,138 6,358
Principal investments (1) 1,423 1,278
Total nonmarketable
equity investments (2) 16,354 16,782
Corporate/bank-owned life insurance 19,515 18,339
Accounts receivable 20,565 22,493
Interest receivable 5,946 5,746
Core deposit intangibles 10,774 11,999
Customer relationship and other intangibles 2,168 3,516
Net deferred taxes 3,212 13,864
Foreclosed assets:
GNMA loans (3) 960 667
Other 2,199 1,526
Operating lease assets 2,395 2,251
Due from customers on acceptances 810 615
Other 19,282 12,003
Total other assets $104,180 109,801
(1) Principal investments are recorded at fair value with realized and unrealized
gains (losses) included in net gains (losses) from equity investments in the
income statement.
(2) Certain amounts in the above table have been reclassified to conform to the
current presentation.
(3) Consistent with regulatory reporting requirements, foreclosed assets include
foreclosed real estate securing GNMA loans. Both principal and interest for
GNMA loans secured by the foreclosed real estate are collectible because the
GNMA loans are insured by the Federal Housing Administration or guaranteed
by the Department of Veterans Affairs.