Wells Fargo 2009 Annual Report Download - page 152
Download and view the complete annual report
Please find page 152 of the 2009 Wells Fargo annual report below. You can navigate through the pages in the report by either clicking on the pages listed below, or by using the keyword search tool below to find specific information within the annual report.-
 1
1 -
2
-
3
-
4
-
5
-
6
-
7
-
8
-
9
-
10
-
11
-
12
-
13
-
14
-
15
-
16
-
17
-
18
-
19
-
20
-
21
-
22
-
23
-
24
-
25
-
26
-
27
-
28
-
29
-
30
-
31
-
32
-
33
-
34
-
35
-
36
-
37
-
38
-
39
-
40
-
41
-
42
-
43
-
44
-
45
-
46
-
47
-
48
-
49
-
50
-
51
-
52
-
53
-
54
-
55
-
56
-
57
-
58
-
59
-
60
-
61
-
62
-
63
-
64
-
65
-
66
-
67
-
68
-
69
-
70
-
71
-
72
-
73
-
74
-
75
-
76
-
77
-
78
-
79
-
80
-
81
-
82
-
83
-
84
-
85
-
86
-
87
-
88
-
89
-
90
-
91
-
92
-
93
-
94
-
95
-
96
-
97
-
98
-
99
-
100
-
101
-
102
-
103
-
104
-
105
-
106
-
107
-
108
-
109
-
110
-
111
-
112
-
113
-
114
-
115
-
116
-
117
-
118
-
119
-
120
-
121
-
122
-
123
-
124
-
125
-
126
-
127
-
128
-
129
-
130
-
131
-
132
-
133
-
134
-
135
-
136
-
137
-
138
-
139
-
140
-
141
-
 142
142 -
 143
143 -
 144
144 -
 145
145 -
 146
146 -
 147
147 -
 148
148 -
 149
149 -
 150
150 -
 151
151 -
 152
152 -
 153
153 -
 154
154 -
 155
155 -
 156
156 -
 157
157 -
 158
158 -
 159
159 -
 160
160 -
 161
161 -
 162
162 -
163
-
164
-
165
-
166
-
167
-
168
-
169
-
170
-
171
-
172
-
173
-
174
-
175
-
176
-
177
-
178
-
179
-
180
-
181
-
182
-
183
-
184
-
185
-
186
-
187
-
188
-
189
-
190
-
191
-
192
-
193
-
194
-
195
-
196
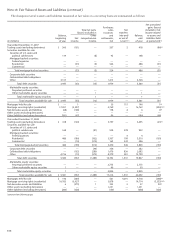
 |
 |

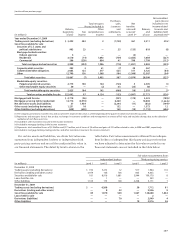
Notional amount
Protection Protection
sold – purchased Net
non- with protection Other
Fair value Protection investment identical sold protection Range of
(in millions) liability sold (A) grade underlyings (B) (A)-(B) purchased maturities
December 31, 2008
Credit default swaps on:
Corporate bonds $ 9,643 83,446 39,987 31,413 52,033 50,585 2009-2018
Structured products 4,940 7,451 5,824 5,061 2,390 6,559 2009-2056
Credit protection on:
Credit default swap index 2,611 35,943 6,364 4,606 31,337 31,410 2009-2017
Commercial mortgage-
backed securities index 2,231 7,291 2,938 1,521 5,770 3,919 2009-2052
Asset-backed securities index 1,331 1,526 1,116 235 1,291 803 2037-2046
Loan deliverable credit default swaps 106 611 592 281 330 1,033 2009-2014
Other 18 845 150 21 824 — 2009-2020
Total credit derivatives $20,880 137,113 56,971 43,138 93,975 94,309
December 31, 2009
Credit default swaps on:
Corporate bonds $ 2,419 55,511 23,815 44,159 11,352 12,634 2010-2018
Structured products 4,498 6,627 5,084 4,999 1,628 3,018 2014-2056
Credit protection on:
Default swap index 23 6,611 2,765 4,202 2,409 2,510 2010-2017
Commercial mortgage-
backed securities index 1,987 5,188 453 4,749 439 189 2049-2052
Asset-backed securities index 637 830 660 696 134 189 2037-2046
Loan deliverable credit default swaps 12 510 494 423 87 287 2010-2014
Other 1 1,416 809 32 1,384 100 2010-2020
Total credit derivatives $ 9,577 76,693 34,080 59,260 17,433 18,927
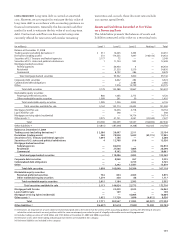
Note 15: Derivatives (continued)
Protection sold represents the estimated maximum
exposure to loss that would be incurred under an assumed
hypothetical circumstance, despite what we believe is its
extremely remote possibility, where the value of our interests
and any associated collateral declines to zero, without any
consideration of recovery or offset from any economic hedges.
Accordingly, this required disclosure is not an indication
of expected loss. The amounts under non-investment grade
represent the notional amounts of those credit derivatives
on which we have a higher performance risk, or higher risk
of being required to perform under the terms of the credit
derivative and is a function of the underlying assets. We
consider the risk of performance to be high if the underlying
assets under the credit derivative have an external rating that
is below investment grade or an internal credit default grade
that is equivalent thereto. We believe the net protection
sold, which is representative of the net notional amount of
protection sold and purchased with identical underlyings,
in combination with other protection purchased, is more rep-
resentative of our exposure to loss than either non-investment
grade or protection sold. Other protection purchased repre-
sents additional protection, which may offset the exposure
to loss for protection sold, that was not purchased with an
identical underlying of the protection sold.
Credit-Risk Contingent Features
Certain of our derivative contracts contain provisions whereby
if the credit rating of our debt, based on certain major credit
rating agencies indicated in the relevant contracts, were to
fall below investment grade, the counterparty could demand
additional collateral or require termination or replacement of
derivative instruments in a net liability position. The aggregate
fair value of all derivative instruments with such credit-risk-
related contingent features that are in a net liability position
on December 31, 2009, was $7.5 billion for which we have
posted $7.1 billion collateral in the normal course of business.
If the credit-risk-related contingent features underlying
these agreements were triggered on December 31, 2009, we
would be required to post additional collateral of $1.0 billion
or potentially settle the contract in an amount equal to its
fair value.
Counterparty Credit Risk
By using derivatives, we are exposed to counterparty
credit risk if counterparties to the derivative contracts do
not perform as expected. If a counterparty fails to perform,
our counterparty credit risk is equal to the amount reported
as a derivative asset on our balance sheet. The amounts
reported as a derivative asset are derivative contracts in a
gain position, and to the extent subject to master netting
arrangements, net of derivatives in a loss position with the
same counterparty and cash collateral received. We minimize
counterparty credit risk through credit approvals, limits,
monitoring procedures, executing master netting arrangements
and obtaining collateral, where appropriate. To the extent
the master netting arrangements and other criteria meet the
requirements outlined in the Derivatives and Hedging topic
of the Codification, derivatives balances and related cash
collateral amounts are shown net in the balance sheet.
Counterparty credit risk related to derivatives is considered
in determining fair value.