Wells Fargo 2009 Annual Report Download - page 37
Download and view the complete annual report
Please find page 37 of the 2009 Wells Fargo annual report below. You can navigate through the pages in the report by either clicking on the pages listed below, or by using the keyword search tool below to find specific information within the annual report.-
 1
1 -
2
-
3
-
4
-
5
-
6
-
7
-
8
-
9
-
10
-
11
-
12
-
13
-
14
-
15
-
16
-
17
-
18
-
19
-
20
-
21
-
22
-
23
-
24
-
25
-
26
-
 27
27 -
 28
28 -
 29
29 -
 30
30 -
 31
31 -
 32
32 -
 33
33 -
 34
34 -
 35
35 -
 36
36 -
 37
37 -
 38
38 -
 39
39 -
 40
40 -
 41
41 -
 42
42 -
 43
43 -
 44
44 -
 45
45 -
 46
46 -
 47
47 -
48
-
49
-
50
-
51
-
52
-
53
-
54
-
55
-
56
-
57
-
58
-
59
-
60
-
61
-
62
-
63
-
64
-
65
-
66
-
67
-
68
-
69
-
70
-
71
-
72
-
73
-
74
-
75
-
76
-
77
-
78
-
79
-
80
-
81
-
82
-
83
-
84
-
85
-
86
-
87
-
88
-
89
-
90
-
91
-
92
-
93
-
94
-
95
-
96
-
97
-
98
-
99
-
100
-
101
-
102
-
103
-
104
-
105
-
106
-
107
-
108
-
109
-
110
-
111
-
112
-
113
-
114
-
115
-
116
-
117
-
118
-
119
-
120
-
121
-
122
-
123
-
124
-
125
-
126
-
127
-
128
-
129
-
130
-
131
-
132
-
133
-
134
-
135
-
136
-
137
-
138
-
139
-
140
-
141
-
142
-
143
-
144
-
145
-
146
-
147
-
148
-
149
-
150
-
151
-
152
-
153
-
154
-
155
-
156
-
157
-
158
-
159
-
160
-
161
-
162
-
163
-
164
-
165
-
166
-
167
-
168
-
169
-
170
-
171
-
172
-
173
-
174
-
175
-
176
-
177
-
178
-
179
-
180
-
181
-
182
-
183
-
184
-
185
-
186
-
187
-
188
-
189
-
190
-
191
-
192
-
193
-
194
-
195
-
196
 |
 |

Our core deposits grew 5% from December 31, 2008, even
though $109 billion in higher-priced Wachovia certificates
of deposit (CDs) matured. Average core deposits funded
93% of total average loans in 2009, up from 82% in 2008.
Checking and savings deposits grew 21% to $679.9 billion
at December 31, 2009, from $563.4 billion a year ago as we
continued to gain new customers and deepen our relation-
ships with existing customers.
As we have stated in the past, to consistently grow over
the long term, successful companies must invest in their core
businesses and maintain strong balance sheets. In 2009, we
opened 70 retail banking stores for a retail network total of
6,629 stores. We converted 19 Wachovia Banking stores in
Colorado to the Wells Fargo platform, as part of the Wachovia
integration, with the conversion of our remaining overlapping
markets scheduled to occur in 2010.
The Wachovia integration remains on track and on
schedule, with business and revenue synergies exceeding our
expectations at the time the merger was announced. Cross-sell
revenues are being realized. We are on track to realize annual
run-rate savings of $5 billion upon completion of the Wachovia
integration in 2011, with over 50% of this annual run rate
already achieved in 2009. We currently expect cumulative
merger integration costs of approximately $5 billion, down
from our $7.9 billion estimate at the time of merger. The
revised estimate reflects lower owned real estate write-downs
and lower employee-related expenses than anticipated at the
time of the merger. In 2009, we spent a total of $1.9 billion in
merger expenses, $1.0 billion through goodwill under purchase
accounting and $895 million expensed through earnings.
We continued taking actions to further strengthen our bal-
ance sheet, including building credit reserves by $3.5 billion
during the year to $25.0 billion at December 31, 2009, reduc-
ing previously identified non-strategic and liquidating loan
portfolios by $18.9 billion to $104.9 billion, and reducing the
value of our debt and equity investment portfolios through
$1.7 billion of other-than-temporary impairment (OTTI) write-
downs. We significantly built capital in 2009 and in the last 15
months since announcing our merger with Wachovia, driven
by record retained earnings and other sources of internal
capital generation, as well as three common stock offerings
totaling over $33 billion, including the $12.2 billion offering in
fourth quarter 2009, which allowed us to repay in full the U.S.
Treasury’s TARP preferred stock investment. We substantially
increased the size of the Company with the Wachovia merger,
and experienced cyclically elevated credit costs; however, our
capital ratios at December 31, 2009, were higher than they
were prior to the Wachovia acquisition, even after redeeming
the TARP preferred stock in full and purchasing Prudential
Financial Inc.’s noncontrolling interest in our retail securities
brokerage joint venture. Tier 1 common equity increased to
$65.5 billion, 6.46% of risk-weighted assets. The Tier 1 capital
ratio increased to 9.25% and Tier 1 leverage ratio declined to
7.87%. See the “Capital Management” section in this Report
for more information regarding Tier 1 common equity.
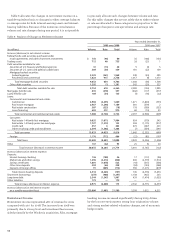
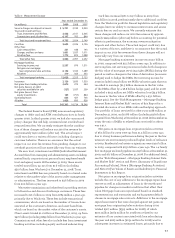
Table 1: Six-Year Summary of Selected Financial Data
% Change Five-year
(in millions, except 2009/ compound
per share amounts) 2009 2008 2007 2006 2005 2004 2008 growth rate
Income statement
Net interest income $ 46,324 25,143 20,974 19,951 18,504 17,150 84% 22
Noninterest income 42,362 16,734 18,546 15,817 14,591 12,930 153 27
Revenue 88,686 41,877 39,520 35,768 33,095 30,080 112 24
Provision for credit losses 21,668 15,979 4,939 2,204 2,383 1,717 36 66
Noninterest expense 49,020 22,598 22,746 20,767 18,943 17,504 117 23
Net income before
noncontrolling interests 12,667 2,698 8,265 8,567 7,892 7,104 369 12
Less: Net income from
noncontrolling interests 392 43 208 147 221 90 812 34
Wells Fargo net income 12,275 2,655 8,057 8,420 7,671 7,014 362 12
Earnings per common share 1.76 0.70 2.41 2.50 2.27 2.07 151 (3)
Diluted earnings
per common share 1.75 0.70 2.38 2.47 2.25 2.05 150 (3)
Dividends declared
per common share 0.49 1.30 1.18 1.08 1.00 0.93 (62) (12)
Balance sheet (at year end)
Securities available for sale $ 172,710 151,569 72,951 42,629 41,834 33,717 14% 39
Loans 782,770 864,830 382,195 319,116 310,837 287,586 (9) 22
Allowance for loan losses 24,516 21,013 5,307 3,764 3,871 3,762 17 45
Goodwill 24,812 22,627 13,106 11,275 10,787 10,681 10 18
Assets 1,243,646 1,309,639 575,442 481,996 481,741 427,849 (5) 24
Core deposits (1) 780,737 745,432 311,731 288,068 253,341 229,703 528
Long-term debt 203,861 267,158 99,393 87,145 79,668 73,580 (24) 23
Wells Fargo
stockholders’ equity 111,786 99,084 47,628 45,814 40,660 37,866 13 24
Noncontrolling interests 2,573 3,232 286 254 239 247 (20) 60
Total equity 114,359 102,316 47,914 46,068 40,899 38,113 12 25
(1) Core deposits are noninterest-bearing deposits, interest-bearing checking, savings certificates, market rate and other savings, and certain foreign deposits
(Eurodollar sweep balances).