Wells Fargo 2009 Annual Report Download - page 136
Download and view the complete annual report
Please find page 136 of the 2009 Wells Fargo annual report below. You can navigate through the pages in the report by either clicking on the pages listed below, or by using the keyword search tool below to find specific information within the annual report.-
 1
1 -
2
-
3
-
4
-
5
-
6
-
7
-
8
-
9
-
10
-
11
-
12
-
13
-
14
-
15
-
16
-
17
-
18
-
19
-
20
-
21
-
22
-
23
-
24
-
25
-
26
-
27
-
28
-
29
-
30
-
31
-
32
-
33
-
34
-
35
-
36
-
37
-
38
-
39
-
40
-
41
-
42
-
43
-
44
-
45
-
46
-
47
-
48
-
49
-
50
-
51
-
52
-
53
-
54
-
55
-
56
-
57
-
58
-
59
-
60
-
61
-
62
-
63
-
64
-
65
-
66
-
67
-
68
-
69
-
70
-
71
-
72
-
73
-
74
-
75
-
76
-
77
-
78
-
79
-
80
-
81
-
82
-
83
-
84
-
85
-
86
-
87
-
88
-
89
-
90
-
91
-
92
-
93
-
94
-
95
-
96
-
97
-
98
-
99
-
100
-
101
-
102
-
103
-
104
-
105
-
106
-
107
-
108
-
109
-
110
-
111
-
112
-
113
-
114
-
115
-
116
-
117
-
118
-
119
-
120
-
121
-
122
-
123
-
124
-
125
-
 126
126 -
 127
127 -
 128
128 -
 129
129 -
 130
130 -
 131
131 -
 132
132 -
 133
133 -
 134
134 -
 135
135 -
 136
136 -
 137
137 -
 138
138 -
 139
139 -
 140
140 -
 141
141 -
 142
142 -
 143
143 -
 144
144 -
 145
145 -
 146
146 -
147
-
148
-
149
-
150
-
151
-
152
-
153
-
154
-
155
-
156
-
157
-
158
-
159
-
160
-
161
-
162
-
163
-
164
-
165
-
166
-
167
-
168
-
169
-
170
-
171
-
172
-
173
-
174
-
175
-
176
-
177
-
178
-
179
-
180
-
181
-
182
-
183
-
184
-
185
-
186
-
187
-
188
-
189
-
190
-
191
-
192
-
193
-
194
-
195
-
196
 |
 |

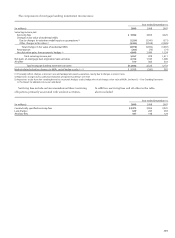
Mortgage banking activities, included in the Community
Banking and Wholesale Banking operating segments,
consist of residential and commercial mortgage originations
and servicing.
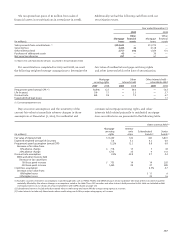
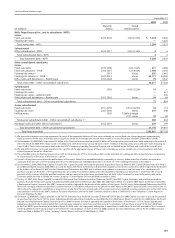
The changes in residential MSRs measured using the fair
value method were:
Note 9: Mortgage Banking Activities
Year ended December 31,
(in millions) 2009 2008 2007
Fair value, beginning of year $14,714 16,763 17,591
Purchases —191 803
Acquired from Wachovia (1) 34 479 —
Servicing from securitizations
or asset transfers 6,226 3,450 3,680
Sales —(269) (1,714)
Net additions 6,260 3,851 2,769
Changes in fair value:
Due to changes in valuation
model inputs or assumptions (2) (1,534) (3,341) (571)
Other changes in fair value (3) (3,436) (2,559) (3,026)
Total changes in fair value (4,970) (5,900) (3,597)
Fair value, end of year $16,004 14,714 16,763
(1) The 2009 amount reflects refinements to initial December 31, 2008,
Wachovia purchase accounting adjustments.
(2) Principally reflects changes in discount rates and prepayment speed
assumptions, mostly due to changes in interest rates.
(3) Represents changes due to collection/realization of expected cash flows
over time.
Year ended December 31,
(in millions) 2009 2008 2007
Balance, beginning of year $1,446 466 377
Purchases (1) 11 10 120
Acquired from Wachovia (2) (135) 1,021 —
Servicing from securitizations
or asset transfers (1) 61 24 40
Amortization (264) (75) (71)
Balance, end of year (3) $1,119 1,446 466
Fair value of amortized MSRs:
Beginning of year $1,555 573 457
End of year 1,261 1,555 573
(1) Based on December 31, 2009, assumptions, the weighted-average amortization
period for MSRs added during the twelve months of 2009 was approximately
18.1 years.
(2) The 2009 amount reflects refinements to initial December 31, 2008,
Wachovia purchase accounting adjustments.
(3) There was no valuation allowance recorded for the periods presented.
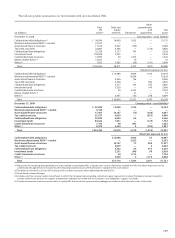
Commercial MSRs are evaluated for impairment purposes by the following
asset classes: agency and non-agency commercial mortgage-backed
securities (MBS), and loans.
The changes in amortized commercial MSRs were:
December 31,
(in billions) 2009 2008 2007
Residential mortgage servicing
Serviced for others $1,422 1,388 1,283
Owned loans serviced 364 378 174
Subservicing 10 15 17
Total residential servicing 1,796 1,781 1,474
Commercial mortgage servicing
Serviced for others 454 472 147
Owned loans serviced 105 103 37
Subservicing 10 11 6
Total commercial servicing 569 586 190
Total managed servicing
portfolio $2,365 2,367 1,664
Total serviced for others $1,876 1,860 1,430
Ratio of MSRs to related loans
serviced for others 0.91% 0.87 1.20
We present the components of our managed servicing
portfolio in the table below at unpaid principal balance for
loans serviced and subserviced for others and at book value
for owned loans serviced.