Wells Fargo 2009 Annual Report Download - page 38
Download and view the complete annual report
Please find page 38 of the 2009 Wells Fargo annual report below. You can navigate through the pages in the report by either clicking on the pages listed below, or by using the keyword search tool below to find specific information within the annual report.-
 1
1 -
2
-
3
-
4
-
5
-
6
-
7
-
8
-
9
-
10
-
11
-
12
-
13
-
14
-
15
-
16
-
17
-
18
-
19
-
20
-
21
-
22
-
23
-
24
-
25
-
26
-
27
-
 28
28 -
 29
29 -
 30
30 -
 31
31 -
 32
32 -
 33
33 -
 34
34 -
 35
35 -
 36
36 -
 37
37 -
 38
38 -
 39
39 -
 40
40 -
 41
41 -
 42
42 -
 43
43 -
 44
44 -
 45
45 -
 46
46 -
 47
47 -
 48
48 -
49
-
50
-
51
-
52
-
53
-
54
-
55
-
56
-
57
-
58
-
59
-
60
-
61
-
62
-
63
-
64
-
65
-
66
-
67
-
68
-
69
-
70
-
71
-
72
-
73
-
74
-
75
-
76
-
77
-
78
-
79
-
80
-
81
-
82
-
83
-
84
-
85
-
86
-
87
-
88
-
89
-
90
-
91
-
92
-
93
-
94
-
95
-
96
-
97
-
98
-
99
-
100
-
101
-
102
-
103
-
104
-
105
-
106
-
107
-
108
-
109
-
110
-
111
-
112
-
113
-
114
-
115
-
116
-
117
-
118
-
119
-
120
-
121
-
122
-
123
-
124
-
125
-
126
-
127
-
128
-
129
-
130
-
131
-
132
-
133
-
134
-
135
-
136
-
137
-
138
-
139
-
140
-
141
-
142
-
143
-
144
-
145
-
146
-
147
-
148
-
149
-
150
-
151
-
152
-
153
-
154
-
155
-
156
-
157
-
158
-
159
-
160
-
161
-
162
-
163
-
164
-
165
-
166
-
167
-
168
-
169
-
170
-
171
-
172
-
173
-
174
-
175
-
176
-
177
-
178
-
179
-
180
-
181
-
182
-
183
-
184
-
185
-
186
-
187
-
188
-
189
-
190
-
191
-
192
-
193
-
194
-
195
-
196
 |
 |

We saw signs of stability emerging in our credit portfolio,
as the rate of growth in credit losses slowed during 2009.
While losses remained elevated as expected, a more favorable
economic outlook and improved credit statistics in several
portfolios further increase our confidence that our credit cycle
is turning, provided economic conditions do not deteriorate.
In the commercial portfolios, we saw some signs that credit
quality may be improving, as the pace of commercial and
commercial real estate (CRE) nonaccrual growth slowed
toward the end of 2009, reflecting our historically strong
underwriting and the purchase accounting adjustments
taken on the Wachovia portfolio at the time of the merger.
We expect credit losses to remain elevated in the near term,
but, assuming no further economic deterioration, current
projections show credit losses peaking in the first half of 2010
in our consumer portfolios and later in 2010 in our commercial
and CRE portfolios. Based on the portfolio performance
data we saw in fourth quarter 2009, and assuming the same
economic outlook, we are tracking somewhat better than
these expectations.
We believe it is important to maintain a well controlled
operating environment as we complete the integration of the
Wachovia businesses and grow the combined company. We
manage our credit risk by setting what we believe are sound
credit policies for underwriting new business, while monitor-
ing and reviewing the performance of our loan portfolio. We
manage the interest rate and market risks inherent in our
asset and liability balances within established ranges, while
ensuring adequate liquidity and funding. We maintain strong
capital levels to facilitate future growth.
WACHOVIA MERGER On December 31, 2008, Wells Fargo
acquired Wachovia, one of the nation’s largest diversified
financial services companies. Wachovia’s assets and liabilities
were included in the December 31, 2008, consolidated balance
sheet at their respective fair values on the acquisition date.
Because the acquisition was completed on December 31, 2008,
Wachovia’s results of operations were not included in our
2008 income statement. Beginning in 2009, our consolidated
results and associated financial information, as well as our
consolidated average balances, include Wachovia. The
Wachovia acquisition was material to us, and the inclusion
of results from Wachovia’s businesses in our 2009 financial
statements is a material factor in the changes in our results
compared with prior year periods.
Because the transaction closed on the last day of the 2008
annual reporting period, certain fair value purchase accounting
adjustments were based on preliminary data as of an interim
period with estimates through year end. We have validated
and, where necessary, refined our December 31, 2008, fair
value estimates and other purchase accounting adjustments.
The impact of these refinements was recorded as an adjust-
ment to goodwill in 2009. Based on the purchase price of
$23.1 billion and the $12.2 billion fair value of net assets
acquired, inclusive of final refinements identified during
2009, the transaction resulted in goodwill of $10.9 billion.
The more significant fair value adjustments in our pur-
chase accounting for the Wachovia acquisition were to loans.
As of December 31, 2008, certain of the loans acquired from
Wachovia had evidence of credit deterioration since origina-
tion, and it was probable that we would not collect all contrac-
tually required principal and interest payments. Such loans
identified at the time of the acquisition were accounted for
using the measurement provisions for purchased credit-
impaired (PCI) loans, which are contained in the Receivables
topic (FASB Accounting Standards Codification (ASC) 310) of
the Codification. PCI loans were recorded at fair value at the
date of acquisition, and any related allowance for loan losses
was not permitted to be carried over.
PCI loans were written down to an amount estimated to
be collectible. Accordingly, such loans are not classified as
nonaccrual, even though they may be contractually past due,
because we expect to fully collect the new carrying values
of such loans (that is, the new cost basis arising out of our
purchase accounting). PCI loans are also not included in the
disclosure of loans 90 days or more past due and still accruing
interest even though a portion of them are 90 days or more
contractually past due.
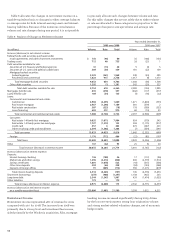
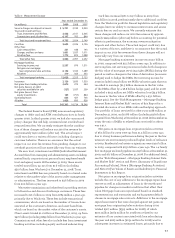
Table 2: Ratios and Per Common Share Data
Year ended December 31,
2009 2008 2007
Profitability ratios
Wells Fargo net income to
average assets (ROA) 0.97% 0.44 1.55
Net income to average assets 1.00 0.45 1.59
Wells Fargo net income applicable to
common stock to average Wells Fargo
common stockholders’ equity (ROE) 9.88 4.79 17.12
Net income to average total equity 10.75 5.02 17.46
Efficiency ratio (1) 55.3 54.0 57.6
Capital ratios
At year end:
Wells Fargo common stockholders’
equity to assets 8.34 5.21 8.28
Total equity to assets 9.20 7.81 8.33
Risk-based capital (2)
Tier 1 capital 9.25 7.84 7.59
Total capital 13.26 11.83 10.68
Tier 1 leverage (2)(3) 7.87 14.52 6.83
Tier 1 common equity (4) 6.46 3.13 6.56
Average balances:
Average Wells Fargo common
stockholders’ equity to average assets 6.41 8.18 9.04
Average total equity to average assets 9.34 8.89 9.09
Per common share data
Dividend payout (5) 27.9 185.4 49.0
Book value $20.03 16.15 14.45
Market price (6)
High 31.53 44.68 37.99
Low 7.80 19.89 29.29
Year end 26.99 29.48 30.19
(1) The efficiency ratio is noninterest expense divided by total revenue
(net interest income and noninterest income).
(2) See Note 25 (Regulatory and Agency Capital Requirements) to Financial
Statements in this Report for additional information.
(3) Due to the Wachovia acquisition that closed on December 31, 2008, the Tier 1
leverage ratio, which considers period-end Tier 1 capital and quarterly averages
in the computation of the ratio, does not reflect average assets of Wachovia for
the full period ended December 31, 2008.
(4) See the “Capital Management” section in this Report for additional information.
(5) Dividends declared per common share as a percentage of earnings per
common share.
(6) Based on daily prices reported on the New York Stock Exchange Composite
Transaction Reporting System.