Wells Fargo 2009 Annual Report Download - page 133
Download and view the complete annual report
Please find page 133 of the 2009 Wells Fargo annual report below. You can navigate through the pages in the report by either clicking on the pages listed below, or by using the keyword search tool below to find specific information within the annual report.-
 1
1 -
2
-
3
-
4
-
5
-
6
-
7
-
8
-
9
-
10
-
11
-
12
-
13
-
14
-
15
-
16
-
17
-
18
-
19
-
20
-
21
-
22
-
23
-
24
-
25
-
26
-
27
-
28
-
29
-
30
-
31
-
32
-
33
-
34
-
35
-
36
-
37
-
38
-
39
-
40
-
41
-
42
-
43
-
44
-
45
-
46
-
47
-
48
-
49
-
50
-
51
-
52
-
53
-
54
-
55
-
56
-
57
-
58
-
59
-
60
-
61
-
62
-
63
-
64
-
65
-
66
-
67
-
68
-
69
-
70
-
71
-
72
-
73
-
74
-
75
-
76
-
77
-
78
-
79
-
80
-
81
-
82
-
83
-
84
-
85
-
86
-
87
-
88
-
89
-
90
-
91
-
92
-
93
-
94
-
95
-
96
-
97
-
98
-
99
-
100
-
101
-
102
-
103
-
104
-
105
-
106
-
107
-
108
-
109
-
110
-
111
-
112
-
113
-
114
-
115
-
116
-
117
-
118
-
119
-
120
-
121
-
122
-
 123
123 -
 124
124 -
 125
125 -
 126
126 -
 127
127 -
 128
128 -
 129
129 -
 130
130 -
 131
131 -
 132
132 -
 133
133 -
 134
134 -
 135
135 -
 136
136 -
 137
137 -
 138
138 -
 139
139 -
 140
140 -
 141
141 -
 142
142 -
 143
143 -
144
-
145
-
146
-
147
-
148
-
149
-
150
-
151
-
152
-
153
-
154
-
155
-
156
-
157
-
158
-
159
-
160
-
161
-
162
-
163
-
164
-
165
-
166
-
167
-
168
-
169
-
170
-
171
-
172
-
173
-
174
-
175
-
176
-
177
-
178
-
179
-
180
-
181
-
182
-
183
-
184
-
185
-
186
-
187
-
188
-
189
-
190
-
191
-
192
-
193
-
194
-
195
-
196
 |
 |

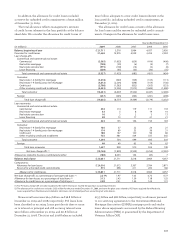
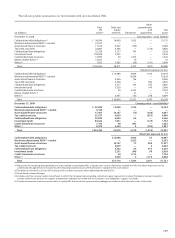
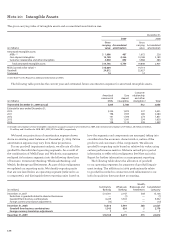
The table below summarizes the weighted-average
credit rating equivalents of the conduit’s assets.
These ratings are based on internal rating criteria.
December 31, 2009 December 31, 2008(1)
Funded Total Funded Total
asset committed asset committed
composition exposure composition exposure
Commercial and middle market loans 42.3% 35.6 27.6 32.6
Auto loans 26.8 29.2 27.6 22.0
Equipment loans 18.5 16.8 14.4 11.4
Leases 4.2 3.2 12.6 11.7
Trade receivables 3.3 10.3 8.8 10.9
Credit cards 1.7 2.7 7.0 7.9
Other 3.2 2.2 2.0 3.5
Total 100.0% 100.0 100.0 100.0
(1) Certain December 31, 2008, percentages have been revised to conform with the December 31, 2009, classification of certain assets.
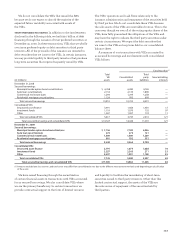
December 31, 2009 December 31, 2008
Funded Total Funded Total
asset committed asset committed
composition exposure composition exposure
AAA —% — 9.4 10.4
AA 12.8 18.7 8.3 11.7
A29.4 36.5 52.2 51.5
BBB/BB 57.8 44.8 30.1 26.4
Total 100.0% 100.0 100.0 100.0
The composition of the conduit’s assets follows:
The timely repayment of the commercial paper is further
supported by asset-specific liquidity facilities in the form of
liquidity asset purchase agreements that we provide. Each
facility is equal to 102% of the conduit’s funding commitment
to a client. The aggregate amount of liquidity must be equal
to or greater than all the commercial paper issued by the
conduit. At the discretion of the administrator, we may be
required to purchase assets from the conduit at par value plus
accrued interest or discount on the related commercial paper,
including situations where the conduit is unable to issue
commercial paper. Par value may be different from fair value.
We receive fees in connection with our role as administrator
and liquidity provider. We may also receive fees related to the
structuring of the conduit’s transactions.
The weighted average life of the commercial paper was
22.5 days at December 31, 2009, and the average yield on
the commercial paper was 0.24%. The ability of the conduit
to issue commercial paper is a function of general market
conditions and the credit rating of the liquidity provider.
At December 31, 2009, we did not hold any of the commercial
paper issued by the conduit.
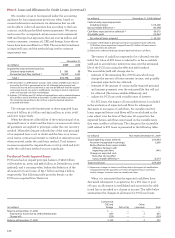
The conduit has issued a subordinated note to a third
party investor. The subordinated note is designed to absorb
the expected variability associated with the credit risk in the
conduit’s assets as well as assets that may be or were funded
by us as a result of a purchase under the provisions of a spe-
cific liquidity asset purchase agreement. Actual credit losses
incurred on the conduit’s assets or assets purchased under
the liquidity facilities are absorbed first by the subordinated
note prior to any allocation to us as the liquidity provider.
We increased the face amount of our subordinated note to
$60 million in March 2009. In fourth quarter 2009, the subor-
dinated note absorbed $16 million of losses. At December 31,
2009, the available balance of the subordinated note was
$44 million. The subordinated note matures in 2017.
At least quarterly, or more often if circumstances dictate,
we assess whether we are the primary beneficiary of the
conduit based on our expectation of the variability associated
with our liquidity facilities and administrative fee arrangement.
Such circumstances may include changes to the terms of the
conduit’s assets, internal credit grades, outstanding amounts
under each facility or the purchase of the conduit’s commercial
paper. We assess variability using a quantitative expected
loss model. The key inputs to the model include internally
generated risk ratings that are mapped to third party rating
agency loss-given-default assumptions. We do not consolidate
the conduit because our expected loss model indicates that
the holder of the subordinated note absorbs the majority
of the variability of the conduit’s assets.
ASSET-BASED FINANCE STRUCTURES We engage in various
forms of structured finance arrangements with VIEs that
are collateralized by various asset classes including energy
contracts, auto and other transportation leases, intellec -
tual property, equipment and general corporate credit. We
typically provide senior financing, and may act as an inter-
est rate swap or commodity derivative counterparty when
necessary. In most cases, we are not the primary beneficiary
of these structures because we do not retain a majority
of the variability in these transactions.