Wells Fargo 2009 Annual Report Download - page 161
Download and view the complete annual report
Please find page 161 of the 2009 Wells Fargo annual report below. You can navigate through the pages in the report by either clicking on the pages listed below, or by using the keyword search tool below to find specific information within the annual report.-
 1
1 -
2
-
3
-
4
-
5
-
6
-
7
-
8
-
9
-
10
-
11
-
12
-
13
-
14
-
15
-
16
-
17
-
18
-
19
-
20
-
21
-
22
-
23
-
24
-
25
-
26
-
27
-
28
-
29
-
30
-
31
-
32
-
33
-
34
-
35
-
36
-
37
-
38
-
39
-
40
-
41
-
42
-
43
-
44
-
45
-
46
-
47
-
48
-
49
-
50
-
51
-
52
-
53
-
54
-
55
-
56
-
57
-
58
-
59
-
60
-
61
-
62
-
63
-
64
-
65
-
66
-
67
-
68
-
69
-
70
-
71
-
72
-
73
-
74
-
75
-
76
-
77
-
78
-
79
-
80
-
81
-
82
-
83
-
84
-
85
-
86
-
87
-
88
-
89
-
90
-
91
-
92
-
93
-
94
-
95
-
96
-
97
-
98
-
99
-
100
-
101
-
102
-
103
-
104
-
105
-
106
-
107
-
108
-
109
-
110
-
111
-
112
-
113
-
114
-
115
-
116
-
117
-
118
-
119
-
120
-
121
-
122
-
123
-
124
-
125
-
126
-
127
-
128
-
129
-
130
-
131
-
132
-
133
-
134
-
135
-
136
-
137
-
138
-
139
-
140
-
141
-
142
-
143
-
144
-
145
-
146
-
147
-
148
-
149
-
150
-
 151
151 -
 152
152 -
 153
153 -
 154
154 -
 155
155 -
 156
156 -
 157
157 -
 158
158 -
 159
159 -
 160
160 -
 161
161 -
 162
162 -
 163
163 -
 164
164 -
 165
165 -
 166
166 -
 167
167 -
 168
168 -
 169
169 -
 170
170 -
 171
171 -
172
-
173
-
174
-
175
-
176
-
177
-
178
-
179
-
180
-
181
-
182
-
183
-
184
-
185
-
186
-
187
-
188
-
189
-
190
-
191
-
192
-
193
-
194
-
195
-
196
 |
 |

December 31,
2009 2008
Fair value Fair value
carrying carrying
amount amount
less less
Fair value Aggregate aggregate Fair value Aggregate aggregate
carrying unpaid unpaid carrying unpaid unpaid
(in millions) amount principal principal amount principal principal
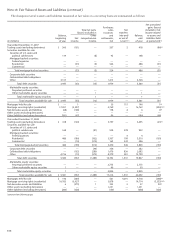
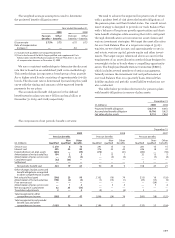
Mortgages held for sale reported at fair value:
Total loans $36,962 37,072 (110)(1) 18,754 18,862 (108)(1)
Nonaccrual loans 268 560 (292) 152 344 (192)
Loans 90 days or more past due and still accruing 49 63 (14) 58 63 (5)
Loans held for sale reported at fair value:
Total loans 149 159 (10) 398 760 (362)
Nonaccrual loans 523 1 17 (16)
(1) The difference between fair value carrying amount and aggregate unpaid principal includes changes in fair value recorded at and subsequent to funding,
gains and losses on the related loan commitment prior to funding, and premiums on acquired loans.
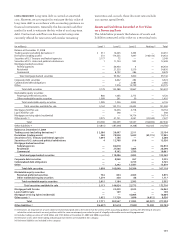
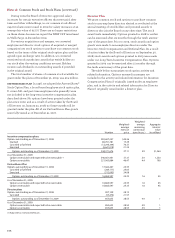
Fair Value Option
The following table reflects the differences between fair
value carrying amount of MHFS and LHFS for which we
have elected the fair value option and the aggregate unpaid
principal amount we are contractually entitled to receive
at maturity.
The assets accounted for under the fair value option are
initially measured at fair value. Gains and losses from initial
measurement and subsequent changes in fair value are
recognized in earnings. The changes in fair values related
to initial measurement and subsequent changes in fair
value included in earnings for these assets measured at
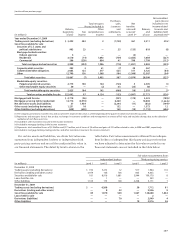
fair value are shown, by income statement line item, below.
Year ended December 31,
2009 2008
Mortgages Loans Other Mortgages Other
held held interests held interests
(in millions) for sale for sale held for sale held
Mortgage banking noninterest income:
Net gains on mortgage loan origination/sales activities (1) $4,891 — — 2,111 —
Other noninterest income — 99 117 — (109)
(1) Includes changes in fair value of servicing associated with MHFS.
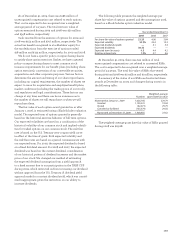
Interest income on MHFS measured at fair value is calcu-
lated based on the note rate of the loan and is recorded in
interest income in the income statement.
For MHFS that are accounted for under the fair value
option, the estimated amount of losses included in earnings
attributable to instrument-specific credit risk was $277 million
and $648 million for the year ended December 31, 2009 and
2008, respectively. For performing loans, instrument-specific
credit risk gains or losses were derived principally by
determining the change in fair value of the loans due to
changes in the observable or implied credit spread. Credit
spread is the market yield on the loans less the relevant risk-
free benchmark interest rate. Since the second half of 2007,
spreads have been significantly impacted by the lack of
liquidity in the secondary market for mortgage loans. For
nonperforming loans, we attribute all changes in fair value
to instrument-specific credit risk.