Wells Fargo 2009 Annual Report Download - page 45
Download and view the complete annual report
Please find page 45 of the 2009 Wells Fargo annual report below. You can navigate through the pages in the report by either clicking on the pages listed below, or by using the keyword search tool below to find specific information within the annual report.-
 1
1 -
2
-
3
-
4
-
5
-
6
-
7
-
8
-
9
-
10
-
11
-
12
-
13
-
14
-
15
-
16
-
17
-
18
-
19
-
20
-
21
-
22
-
23
-
24
-
25
-
26
-
27
-
28
-
29
-
30
-
31
-
32
-
33
-
34
-
 35
35 -
 36
36 -
 37
37 -
 38
38 -
 39
39 -
 40
40 -
 41
41 -
 42
42 -
 43
43 -
 44
44 -
 45
45 -
 46
46 -
 47
47 -
 48
48 -
 49
49 -
 50
50 -
 51
51 -
 52
52 -
 53
53 -
 54
54 -
 55
55 -
56
-
57
-
58
-
59
-
60
-
61
-
62
-
63
-
64
-
65
-
66
-
67
-
68
-
69
-
70
-
71
-
72
-
73
-
74
-
75
-
76
-
77
-
78
-
79
-
80
-
81
-
82
-
83
-
84
-
85
-
86
-
87
-
88
-
89
-
90
-
91
-
92
-
93
-
94
-
95
-
96
-
97
-
98
-
99
-
100
-
101
-
102
-
103
-
104
-
105
-
106
-
107
-
108
-
109
-
110
-
111
-
112
-
113
-
114
-
115
-
116
-
117
-
118
-
119
-
120
-
121
-
122
-
123
-
124
-
125
-
126
-
127
-
128
-
129
-
130
-
131
-
132
-
133
-
134
-
135
-
136
-
137
-
138
-
139
-
140
-
141
-
142
-
143
-
144
-
145
-
146
-
147
-
148
-
149
-
150
-
151
-
152
-
153
-
154
-
155
-
156
-
157
-
158
-
159
-
160
-
161
-
162
-
163
-
164
-
165
-
166
-
167
-
168
-
169
-
170
-
171
-
172
-
173
-
174
-
175
-
176
-
177
-
178
-
179
-
180
-
181
-
182
-
183
-
184
-
185
-
186
-
187
-
188
-
189
-
190
-
191
-
192
-
193
-
194
-
195
-
196
 |
 |

The Federal Reserve Board (FRB) announced regulatory
changes to debit card and ATM overdraft practices in fourth
quarter 2009. In third quarter 2009, we had also announced
policy changes that will help customers limit overdraft and
returned item fees. We currently estimate that the combina-
tion of these changes will reduce our 2010 fee revenue by
approximately $500 million (after tax). The actual impact
could vary due to a variety of factors including changes in
customer behavior. There is no assurance that the actual
impact on our 2010 fee revenue from pending changes to our
overdraft practices will not materially vary from our estimate.
We earn trust, investment and IRA (Individual Retirement
Account) fees from managing and administering assets, including
mutual funds, corporate trust, personal trust, employee benefit
trust and agency assets. At December 31, 2009, these assets
totaled $1.9 trillion, up 19% from $1.6 trillion (including
$510 billion from Wachovia) at December 31, 2008. Trust,
investment and IRA fees are primarily based on a tiered scale
relative to the market value of the assets under management
or administration. The fees increased to $3.6 billion in 2009
from $2.2 billion a year ago.
We receive commissions and other fees for providing services
to full-service and discount brokerage customers. These fees
increased to $6.1 billion in 2009 from $763 million a year ago,
primarily due to Wachovia. These fees include transactional
commissions, which are based on the number of transactions
executed at the customer’s direction, and asset-based fees,
which are based on the market value of the customer’s assets.
Client assets totaled $1.1 trillion at December 31, 2009, up from
$970 billion (including $859 billion from Wachovia) a year ago.
Commissions and other fees also include fees from investment
banking activities including equity and bond underwriting.
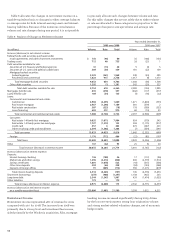
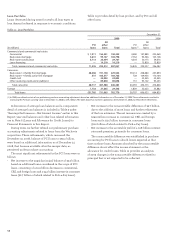
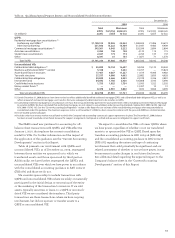
Table 7: Noninterest Income
Year ended December 31,
(in millions) 2009 2008 2007
Service charges on deposit accounts $ 5,741 3,190 3,050
Trust and investment fees:
Trust, investment and IRA fees 3,588 2,161 2,305
Commissions and all other fees 6,147 763 844
Total trust and investment fees 9,735 2,924 3,149
Card fees 3,683 2,336 2,136
Other fees:
Cash network fees 231 188 193
Charges and fees on loans 1,801 1,037 1,011
All other fees 1,772 872 1,088
Total other fees 3,804 2,097 2,292
Mortgage banking:
Servicing income, net 5,557 979 1,511
Net gains on mortgage
loan origination/sales activities 6,152 1,183 1,289
All other 319 363 333
Total mortgage banking 12,028 2,525 3,133
Insurance 2,126 1,830 1,530
Net gains from trading activities 2,674 275 544
Net gains (losses) on debt
securities available for sale (127) 1,037 209
Net gains (losses) from
equity investments 185 (757) 864
Operating leases 685 427 703
All other 1,828 850 936
Total $42,362 16,734 18,546
Card fees increased 58% to $3.7 billion in 2009 from
$2.3 billion in 2008, predominantly due to additional card fees
from the Wachovia portfolio. Recent legislative and regulatory
changes limit our ability to increase interest rates and assess
certain fees on card accounts. We currently estimate that
these changes will reduce our 2010 fee revenue by approxi-
mately $235 million (after tax) before accounting for potential
offsets in performance, the economy, revenue mitigation
impacts and other factors. The actual impact could vary due
to a variety of factors, and there is no assurance that the actual
impact on our 2010 fee revenue from these changes will not
materially vary from our estimate.
Mortgage banking noninterest income was $12.0 billion
in 2009, compared with $2.5 billion a year ago. In addition to
servicing fees, net servicing income includes both changes in
the fair value of mortgage servicing rights (MSRs) during the
period as well as changes in the value of derivatives (economic
hedges) used to hedge the MSRs. Net servicing income for
2009 included a $5.3 billion net MSRs valuation gain that was
recorded to earnings ($1.5 billion decrease in the fair value
of the MSRs offset by a $6.8 billion hedge gain) and for 2008
included a $242 million net MSRs valuation loss ($3.3 billion
decrease in the fair value of MSRs offset by a $3.1 billion
hedge gain). See the “Risk Management – Mortgage Banking
Interest Rate and Market Risk” section of this Report for a
detailed discussion of our MSRs risks and hedging approach.
Our portfolio of loans serviced for others was $1.88 trillion at
December 31, 2009, and $1.86 trillion (including $379 billion
acquired from Wachovia) at December 31, 2008. At December 31,
2009, the ratio of MSRs to related loans serviced for others
was 0.91%.
Net gains on mortgage loan origination/sales activities
of $6.2 billion for 2009 were up from $1.2 billion a year ago,
due to strong business performance during the year as the low
interest-rate environment produced higher levels of refinance
activity. Residential real estate originations were $420 billion
in 2009, compared with $230 billion a year ago. The 1-4 family
first mortgage unclosed pipeline was $57 billion at December 31,
2009, and $71 billion at December 31, 2008. For additional detail,
see the “Risk Management – Mortgage Banking Interest Rate
and Market Risk” section and Note 1 (Summary of Significant
Accounting Policies), Note 9 (Mortgage Banking Activities)
and Note 16 (Fair Values of Assets and Liabilities) to Financial
Statements in this Report.
Net gains on mortgage loan origination/sales activities
include the cost of any additions to the mortgage repurchase
reserve as well as adjustments of loans in the warehouse/
pipeline for changes in market conditions that affect their
value. Mortgage loans are repurchased based on standard
representations and warranties and early payment default
clauses in mortgage sale contracts. Additions to the mortgage
repurchase reserve that were charged against net gains on
mortgage loan origination/sales activities during 2009
totaled $927 million ($399 million for 2008), of which
$302 million ($165 million for 2008) was related to our
estimate of loss content associated with loan sales during
the year and $625 million ($234 million for 2008) was for
subsequent increases in estimated losses, primarily due to