Wells Fargo 2009 Annual Report Download - page 43
Download and view the complete annual report
Please find page 43 of the 2009 Wells Fargo annual report below. You can navigate through the pages in the report by either clicking on the pages listed below, or by using the keyword search tool below to find specific information within the annual report.-
 1
1 -
2
-
3
-
4
-
5
-
6
-
7
-
8
-
9
-
10
-
11
-
12
-
13
-
14
-
15
-
16
-
17
-
18
-
19
-
20
-
21
-
22
-
23
-
24
-
25
-
26
-
27
-
28
-
29
-
30
-
31
-
32
-
 33
33 -
 34
34 -
 35
35 -
 36
36 -
 37
37 -
 38
38 -
 39
39 -
 40
40 -
 41
41 -
 42
42 -
 43
43 -
 44
44 -
 45
45 -
 46
46 -
 47
47 -
 48
48 -
 49
49 -
 50
50 -
 51
51 -
 52
52 -
 53
53 -
54
-
55
-
56
-
57
-
58
-
59
-
60
-
61
-
62
-
63
-
64
-
65
-
66
-
67
-
68
-
69
-
70
-
71
-
72
-
73
-
74
-
75
-
76
-
77
-
78
-
79
-
80
-
81
-
82
-
83
-
84
-
85
-
86
-
87
-
88
-
89
-
90
-
91
-
92
-
93
-
94
-
95
-
96
-
97
-
98
-
99
-
100
-
101
-
102
-
103
-
104
-
105
-
106
-
107
-
108
-
109
-
110
-
111
-
112
-
113
-
114
-
115
-
116
-
117
-
118
-
119
-
120
-
121
-
122
-
123
-
124
-
125
-
126
-
127
-
128
-
129
-
130
-
131
-
132
-
133
-
134
-
135
-
136
-
137
-
138
-
139
-
140
-
141
-
142
-
143
-
144
-
145
-
146
-
147
-
148
-
149
-
150
-
151
-
152
-
153
-
154
-
155
-
156
-
157
-
158
-
159
-
160
-
161
-
162
-
163
-
164
-
165
-
166
-
167
-
168
-
169
-
170
-
171
-
172
-
173
-
174
-
175
-
176
-
177
-
178
-
179
-
180
-
181
-
182
-
183
-
184
-
185
-
186
-
187
-
188
-
189
-
190
-
191
-
192
-
193
-
194
-
195
-
196
 |
 |

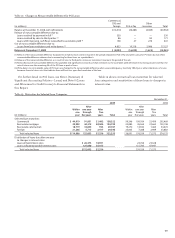
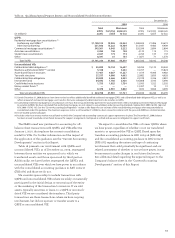
(5) Includes certain preferred securities.
(6) Nonaccrual loans and related income are included in their respective loan categories.
(7) Includes taxable-equivalent adjustments primarily related to tax-exempt income on certain loans and securities. The federal statutory tax rate was 35% for the
periods presented.
(8) See Note 7 (Premises, Equipment, Lease Commitments and Other Assets) to Financial Statements in this Report for detail of balances of other noninterest-earning
assets at December 31, 2009 and 2008.
2007 2006 2005
Interest Interest Interest
Average Yields/ income/ Average Yields/ income/ Average Yields/ income/
balance rates expense balance rates expense balance rates expense
$ 4,468 4.99% $ 223 5,515 4.80% $ 265 5,448 3.01% $ 164
4,291 4.37 188 4,958 4.95 245 5,411 3.52 190
848 4.26 36 875 4.36 39 997 3.81 38
4,740 7.37 342 3,192 7.98 245 3,395 8.27 266
38,592 6.10 2,328 36,691 6.04 2,206 19,768 6.02 1,162
6,548 6.12 399 6,640 6.57 430 5,128 5.60 283
45,140 6.10 2,727 43,331 6.12 2,636 24,896 5.94 1,445
6,295 7.52 477 6,204 7.10 439 3,846 7.10 266
57,023 6.34 3,582 53,602 6.31 3,359 33,134 6.24 2,015
33,066 6.50 2,150 42,855 6.41 2,746 38,986 5.67 2,213
896 7.76 70 630 7.40 47 2,857 5.10 146
77,965 8.17 6,367 65,720 8.13 5,340 58,434 6.76 3,951
32,722 7.38 2,414 29,344 7.32 2,148 29,098 6.31 1,836
16,934 7.80 1,321 14,810 7.94 1,175 11,086 6.67 740
5,921 5.84 346 5,437 5.72 311 5,226 5.91 309
133,542 7.82 10,448 115,311 7.78 8,974 103,844 6.58 6,836
61,527 7.25 4,463 57,509 7.27 4,182 78,170 6.42 5,016
72,075 8.12 5,851 64,255 7.98 5,126 55,616 6.61 3,679
15,874 13.58 2,155 12,571 13.29 1,670 10,663 12.33 1,315
54,436 9.71 5,285 50,922 9.60 4,889 43,102 8.80 3,794
203,912 8.71 17,754 185,257 8.57 15,867 187,551 7.36 13,804
7,321 11.68 855 6,343 12.39 786 4,711 13.49 636
344,775 8.43 29,057 306,911 8.35 25,627 296,106 7.19 21,276
1,402 5.07 71 1,357 4.97 68 1,581 4.34 68
$445,921 7.93% $35,341 415,828 7.79% $32,357 383,523 6.81% $26,072
$ 5,057 3.16% $ 160 4,302 2.86% $ 123 3,607 1.43% $ 51
147,939 2.78 4,105 134,248 2.40 3,225 129,291 1.45 1,874
40,484 4.38 1,773 32,355 3.91 1,266 22,638 2.90 656
8,937 4.87 435 32,168 4.99 1,607 27,676 3.29 910
36,761 4.57 1,679 20,724 4.60 953 11,432 3.12 357
239,178 3.41 8,152 223,797 3.21 7,174 194,644 1.98 3,848
25,854 4.81 1,245 21,471 4.62 992 24,074 3.09 744
93,193 5.18 4,824 84,035 4.91 4,124 79,137 3.62 2,866
— — — — — — — — —
358,225 3.97 14,221 329,303 3.73 12,290 297,855 2.50 7,458
87,696 — — 86,525 — — 85,668 — —
$445,921 3.19 14,221 415,828 2.96 12,290 383,523 1.95 7,458
4.74% $21,120 4.83% $20,067 4.86% $18,614
$ 11,806 12,466 13,173
11,957 11,114 10,705
51,068 46,615 38,389
$74,831 70,195 62,267
$ 88,907 89,117 87,218
26,287 24,221 21,316
47,333 43,382 39,401
(87,696) (86,525) (85,668)
$74,831 70,195 62,267
$520,752 486,023 445,790