Wells Fargo 2009 Annual Report Download - page 149
Download and view the complete annual report
Please find page 149 of the 2009 Wells Fargo annual report below. You can navigate through the pages in the report by either clicking on the pages listed below, or by using the keyword search tool below to find specific information within the annual report.-
 1
1 -
2
-
3
-
4
-
5
-
6
-
7
-
8
-
9
-
10
-
11
-
12
-
13
-
14
-
15
-
16
-
17
-
18
-
19
-
20
-
21
-
22
-
23
-
24
-
25
-
26
-
27
-
28
-
29
-
30
-
31
-
32
-
33
-
34
-
35
-
36
-
37
-
38
-
39
-
40
-
41
-
42
-
43
-
44
-
45
-
46
-
47
-
48
-
49
-
50
-
51
-
52
-
53
-
54
-
55
-
56
-
57
-
58
-
59
-
60
-
61
-
62
-
63
-
64
-
65
-
66
-
67
-
68
-
69
-
70
-
71
-
72
-
73
-
74
-
75
-
76
-
77
-
78
-
79
-
80
-
81
-
82
-
83
-
84
-
85
-
86
-
87
-
88
-
89
-
90
-
91
-
92
-
93
-
94
-
95
-
96
-
97
-
98
-
99
-
100
-
101
-
102
-
103
-
104
-
105
-
106
-
107
-
108
-
109
-
110
-
111
-
112
-
113
-
114
-
115
-
116
-
117
-
118
-
119
-
120
-
121
-
122
-
123
-
124
-
125
-
126
-
127
-
128
-
129
-
130
-
131
-
132
-
133
-
134
-
135
-
136
-
137
-
138
-
 139
139 -
 140
140 -
 141
141 -
 142
142 -
 143
143 -
 144
144 -
 145
145 -
 146
146 -
 147
147 -
 148
148 -
 149
149 -
 150
150 -
 151
151 -
 152
152 -
 153
153 -
 154
154 -
 155
155 -
 156
156 -
 157
157 -
 158
158 -
 159
159 -
160
-
161
-
162
-
163
-
164
-
165
-
166
-
167
-
168
-
169
-
170
-
171
-
172
-
173
-
174
-
175
-
176
-
177
-
178
-
179
-
180
-
181
-
182
-
183
-
184
-
185
-
186
-
187
-
188
-
189
-
190
-
191
-
192
-
193
-
194
-
195
-
196
 |
 |
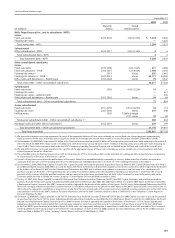
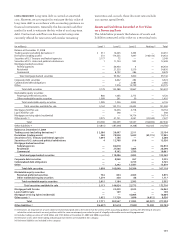
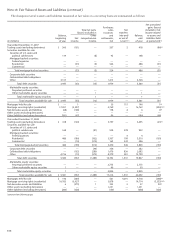
The total notional or contractual amounts and fair values for derivatives were:
December 31, 2009 December 31, 2008
Notional or Fair value Notional or Fair value
contractual Asset Liability contractual Asset Liability
(in millions) amount derivatives derivatives amount derivatives derivatives
Qualifying hedge contracts (1)
Interest rate contracts (2) $ 119,966 6,425 1,302 191,972 11,511 3,287
Foreign exchange contracts 30,212 1,553 811 38,386 1,138 1,198
Total derivatives designated as qualifying
hedging instruments 7,978 2,113 12,649 4,485
Derivatives not designated as hedging instruments
Free-standing derivatives (economic hedges) (1):
Interest rate contracts (3) 633,734 4,441 4,873 750,728 12,635 9,708
Equity contracts 300 — 2 ———
Foreign exchange contracts 7,019 233 29 4,208 150 325
Credit contracts – protection purchased 577 261 — 644 528 —
Other derivatives 4,583 — 40 4,458 108 71
Subtotal 4,935 4,944 13,421 10,104
Customer accommodation, trading
and other free-standing derivatives (4):
Interest rate contracts 2,734,664 54,687 53,905 3,752,656 142,739 141,508
Commodity contracts 92,182 5,400 5,182 86,360 6,117 6,068
Equity contracts 27,123 2,434 2,977 37,136 3,088 2,678
Foreign exchange contracts 172,018 3,084 2,737 273,437 7,562 7,419
Credit contracts – protection sold 76,693 979 9,577 137,113 349 20,880
Credit contracts – protection purchased 81,357 9,349 1,089 140,442 22,100 1,281
Other derivatives 8,717 638 389 1,490 28 150
Subtotal 76,571 75,856 181,983 179,984
Total derivatives not designated as hedging instruments 81,506 80,800 195,404 190,088
Total derivatives before netting 89,484 82,913 208,053 194,573
Netting (5) (65,926) (73,303) (168,690) (182,435)
Total $ 23,558 9,610 39,363 12,138
(1) Represents asset/liability management hedges, which are included in other assets or other liabilities.
(2) Notional amounts presented exclude $20.9 billion of basis swaps that are combined with receive fixed-rate/pay floating-rate swaps and designated as one
hedging instrument.
(3) Includes free-standing derivatives (economic hedges) used to hedge the risk of changes in the fair value of residential MSRs, MHFS, interest rate lock commitments
and other interests held.
(4) Customer accommodation, trading and other free-standing derivatives are included in trading assets or other liabilities.
(5) Represents netting of derivative asset and liability balances, and related cash collateral, with the same counterparty subject to master netting arrangements under
the accounting guidance covering the offsetting of amounts related to certain contracts. The amount of cash collateral netted against derivative assets and liabilities
was $5.3 billion and $14.1 billion, respectively, at December 31, 2009, and $17.7 billion and $22.2 billion, respectively, at December 31, 2008.
Fair Value Hedges
We use interest rate swaps to convert certain of our fixed-rate
long-term debt and CDs to floating rates to hedge our expo-
sure to interest rate risk. We also enter into cross-currency
swaps, cross-currency interest rate swaps and forward
contracts to hedge our exposure to foreign currency risk
and interest rate risk associated with the issuance of non-U.S.
dollar denominated long-term debt and repurchase agree-
ments. Consistent with our asset/liability management
strategy of converting fixed-rate debt to floating rates, we
believe interest expense should reflect only the current con-
tractual interest cash flows on the liabilities and the related
swaps. In addition, we use interest rate swaps and forward
contracts to hedge against changes in fair value of certain
debt securities that are classified as securities available for
sale, due to changes in interest rates, foreign currency rates,
or both. For fair value hedges of long-term debt, CDs, repur-
chase agreements and debt securities, all parts of each
derivative’s gain or loss due to the hedged risk are included
in the assessment of hedge effectiveness, except for foreign-
currency denominated securities available for sale, short-term
borrowings and long-term debt hedged with forward deriva-
tives for which the time value component of the derivative gain
or loss is excluded from the assessment of hedge effectiveness.
For fair value hedging relationships, we use statistical
regression analysis to assess hedge effectiveness, both at
inception of the hedging relationship and on an ongoing
basis. The regression analysis involves regressing the
periodic change in fair value of the hedging instrument
against the periodic changes in fair value of the asset or
liability being hedged due to changes in the hedged risk(s).
The assessment includes an evaluation of the quantitative
measures of the regression results used to validate the
conclusion of high effectiveness.