Wells Fargo 2009 Annual Report Download - page 189
Download and view the complete annual report
Please find page 189 of the 2009 Wells Fargo annual report below. You can navigate through the pages in the report by either clicking on the pages listed below, or by using the keyword search tool below to find specific information within the annual report.-
 1
1 -
2
-
3
-
4
-
5
-
6
-
7
-
8
-
9
-
10
-
11
-
12
-
13
-
14
-
15
-
16
-
17
-
18
-
19
-
20
-
21
-
22
-
23
-
24
-
25
-
26
-
27
-
28
-
29
-
30
-
31
-
32
-
33
-
34
-
35
-
36
-
37
-
38
-
39
-
40
-
41
-
42
-
43
-
44
-
45
-
46
-
47
-
48
-
49
-
50
-
51
-
52
-
53
-
54
-
55
-
56
-
57
-
58
-
59
-
60
-
61
-
62
-
63
-
64
-
65
-
66
-
67
-
68
-
69
-
70
-
71
-
72
-
73
-
74
-
75
-
76
-
77
-
78
-
79
-
80
-
81
-
82
-
83
-
84
-
85
-
86
-
87
-
88
-
89
-
90
-
91
-
92
-
93
-
94
-
95
-
96
-
97
-
98
-
99
-
100
-
101
-
102
-
103
-
104
-
105
-
106
-
107
-
108
-
109
-
110
-
111
-
112
-
113
-
114
-
115
-
116
-
117
-
118
-
119
-
120
-
121
-
122
-
123
-
124
-
125
-
126
-
127
-
128
-
129
-
130
-
131
-
132
-
133
-
134
-
135
-
136
-
137
-
138
-
139
-
140
-
141
-
142
-
143
-
144
-
145
-
146
-
147
-
148
-
149
-
150
-
151
-
152
-
153
-
154
-
155
-
156
-
157
-
158
-
159
-
160
-
161
-
162
-
163
-
164
-
165
-
166
-
167
-
168
-
169
-
170
-
171
-
172
-
173
-
174
-
175
-
176
-
177
-
178
-
 179
179 -
 180
180 -
 181
181 -
 182
182 -
 183
183 -
 184
184 -
 185
185 -
 186
186 -
 187
187 -
 188
188 -
 189
189 -
 190
190 -
 191
191 -
 192
192 -
 193
193 -
 194
194 -
 195
195 -
 196
196
 |
 |

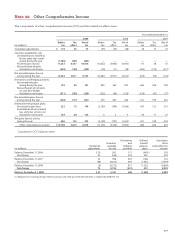
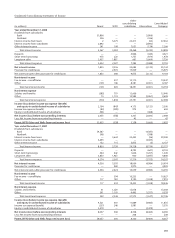
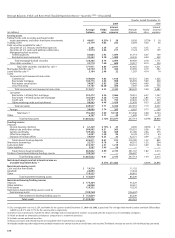
Quarterly Financial Data
Condensed Consolidated Statement of Income – Quarterly (Unaudited)
2009 2008
Quarter ended Quarter ended
(in millions, except per share amounts) Dec. 31 Sept. 30 June 30 Mar. 31 Dec. 31 Sept. 30 June 30 Mar. 31
Interest income $13,692 13,968 14,301 14,313 8,728 8,774 8,547 8,849
Interest expense 2,192 2,284 2,537 2,937 2,004 2,393 2,269 3,089
Net interest income 11,500 11,684 11,764 11,376 6,724 6,381 6,278 5,760
Provision for credit losses 5,913 6,111 5,086 4,558 8,444 2,495 3,012 2,028
Net interest income after
provision for credit losses 5,587 5,573 6,678 6,818 (1,720) 3,886 3,266 3,732
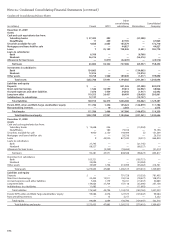
Noninterest income
Service charges on deposit accounts 1,421 1,478 1,448 1,394 803 839 800 748
Trust and investment fees 2,605 2,502 2,413 2,215 661 738 762 763
Card fees 961 946 923 853 589 601 588 558
Other fees 990 950 963 901 535 552 511 499
Mortgage banking 3,411 3,067 3,046 2,504 (195) 892 1,197 631
Insurance 482 468 595 581 337 439 550 504
Net gains (losses) from trading activities 516 622 749 787 (409) 65 516 103
Net gains (losses) on debt securities
available for sale 110 (40) (78) (119) 721 84 (91) 323
Net gains (losses) from equity investments 273 29 40 (157) (608) (509) 47 313
Operating leases 163 224 168 130 62 102 120 143
Other 264 536 476 552 257 193 182 218
Total noninterest income 11,196 10,782 10,743 9,641 2,753 3,996 5,182 4,803
Noninterest expense
Salaries 3,505 3,428 3,438 3,386 2,168 2,078 2,030 1,984
Commission and incentive compensation 2,086 2,051 2,060 1,824 671 555 806 644
Employee benefits 1,144 1,034 1,227 1,284 338 486 593 587
Equipment 681 563 575 687 402 302 305 348
Net occupancy 770 778 783 796 418 402 400 399
Core deposit and other intangible 642 642 646 647 47 47 46 46
FDIC and other deposit assessments 302 228 981 338 57 37 18 8
Other 3,691 2,960 2,987 2,856 1,709 1,594 1,647 1,426
Total noninterest expense 12,821 11,684 12,697 11,818 5,810 5,501 5,845 5,442
Income (loss) before income tax expense 3,962 4,671 4,724 4,641 (4,777) 2,381 2,603 3,093
Income tax expense (benefit) 949 1,355 1,475 1,552 (2,036) 730 834 1,074
Net income (loss) before
noncontrolling interests 3,013 3,316 3,249 3,089 (2,741) 1,651 1,769 2,019
Less: Net income (loss) from
noncontrolling interests 190 81 77 44 (7)141620
Wells Fargo net income (loss) $ 2,823 3,235 3,172 3,045 (2,734) 1,637 1,753 1,999
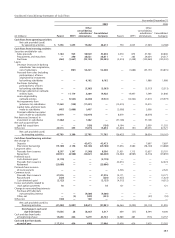
Wells Fargo net income (loss)
applicable to common stock $ 394 2,637 2,575 2,384 (3,020) 1,637 1,753 1,999
Per share information
Earnings (loss) per common share $ 0.08 0.56 0.58 0.56 (0.84) 0.49 0.53 0.61
Diluted earnings (loss) per common share 0.08 0.56 0.57 0.56 (0.84) 0.49 0.53 0.60
Dividends declared per common share 0.05 0.05 0.05 0.34 0.34 0.34 0.31 0.31
Average common shares outstanding 4,764.8 4,678.3 4,483.1 4,247.4 3,582.4 3,316.4 3,309.8 3,302.4
Diluted average common shares outstanding 4,796.1 4,706.4 4,501.6 4,249.3 3,593.6 3,331.0 3,321.4 3,317.9
Market price per common share (1)
High $ 31.53 29.56 28.45 30.47 38.95 44.68 32.40 34.56
Low 25.00 22.08 13.65 7.80 19.89 20.46 23.46 24.38
Quarter-end 26.99 28.18 24.26 14.24 29.48 37.53 23.75 29.10
(1) Based on daily prices reported on the New York Stock Exchange Composite Transaction Reporting System.