Wells Fargo 2009 Annual Report Download - page 42
Download and view the complete annual report
Please find page 42 of the 2009 Wells Fargo annual report below. You can navigate through the pages in the report by either clicking on the pages listed below, or by using the keyword search tool below to find specific information within the annual report.-
 1
1 -
2
-
3
-
4
-
5
-
6
-
7
-
8
-
9
-
10
-
11
-
12
-
13
-
14
-
15
-
16
-
17
-
18
-
19
-
20
-
21
-
22
-
23
-
24
-
25
-
26
-
27
-
28
-
29
-
30
-
31
-
 32
32 -
 33
33 -
 34
34 -
 35
35 -
 36
36 -
 37
37 -
 38
38 -
 39
39 -
 40
40 -
 41
41 -
 42
42 -
 43
43 -
 44
44 -
 45
45 -
 46
46 -
 47
47 -
 48
48 -
 49
49 -
 50
50 -
 51
51 -
 52
52 -
53
-
54
-
55
-
56
-
57
-
58
-
59
-
60
-
61
-
62
-
63
-
64
-
65
-
66
-
67
-
68
-
69
-
70
-
71
-
72
-
73
-
74
-
75
-
76
-
77
-
78
-
79
-
80
-
81
-
82
-
83
-
84
-
85
-
86
-
87
-
88
-
89
-
90
-
91
-
92
-
93
-
94
-
95
-
96
-
97
-
98
-
99
-
100
-
101
-
102
-
103
-
104
-
105
-
106
-
107
-
108
-
109
-
110
-
111
-
112
-
113
-
114
-
115
-
116
-
117
-
118
-
119
-
120
-
121
-
122
-
123
-
124
-
125
-
126
-
127
-
128
-
129
-
130
-
131
-
132
-
133
-
134
-
135
-
136
-
137
-
138
-
139
-
140
-
141
-
142
-
143
-
144
-
145
-
146
-
147
-
148
-
149
-
150
-
151
-
152
-
153
-
154
-
155
-
156
-
157
-
158
-
159
-
160
-
161
-
162
-
163
-
164
-
165
-
166
-
167
-
168
-
169
-
170
-
171
-
172
-
173
-
174
-
175
-
176
-
177
-
178
-
179
-
180
-
181
-
182
-
183
-
184
-
185
-
186
-
187
-
188
-
189
-
190
-
191
-
192
-
193
-
194
-
195
-
196
 |
 |

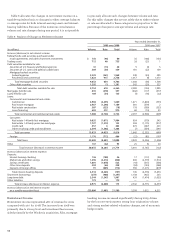
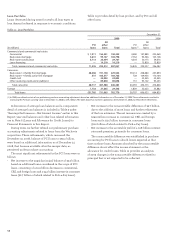
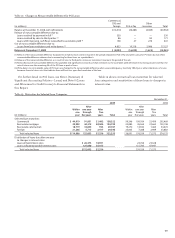
(1) Because the Wachovia acquisition was completed at the end of 2008, Wachovia’s assets and liabilities are included in average balances, and Wachovia’s results are
reflected in interest income/expense beginning in 2009.
(2) Our average prime rate was 3.25%, 5.09%, 8.05%, 7.96% and 6.19% for 2009, 2008, 2007, 2006 and 2005, respectively. The average three-month London Interbank
Offered Rate (LIBOR) was 0.69%, 2.93%, 5.30%, 5.20% and 3.56% for the same years, respectively.
(3) Interest rates and amounts include the effects of hedge and risk management activities associated with the respective asset and liability categories.
(4) Yields are based on amortized cost balances computed on a settlement date basis.
Table 5: Average Balances, Yields and Rates Paid (Taxable-Equivalent Basis) (1)(2)(3)
2009 2008
Interest Interest
Average Yields/ income/ Average Yields/ income/
(in millions) balance rates expense balance rates expense
Earning assets
Federal funds sold, securities purchased under
resale agreements and other short-term investments $ 26,869 0.56% $ 150 5,293 1.71% $ 90
Trading assets 21,092 4.48 944 4,971 3.80 189
Debt securities available for sale (4):
Securities of U.S. Treasury and federal agencies 2,480 2.83 69 1,083 3.84 41
Securities of U.S. states and political subdivisions 12,702 6.42 840 6,918 6.83 501
Mortgage-backed securities:
Federal agencies 87,197 5.45 4,591 44,777 5.97 2,623
Residential and commercial 41,618 9.09 4,150 20,749 6.04 1,412
Total mortgage-backed securities 128,815 6.73 8,741 65,526 5.99 4,035
Other debt securities (5) 32,011 7.16 2,291 12,818 7.17 1,000
Total debt securities available for sale (5) 176,008 6.73 11,941 86,345 6.22 5,577
Mortgages held for sale (6) 37,416 5.16 1,930 25,656 6.13 1,573
Loans held for sale (6) 6,293 2.90 183 837 5.69 48
Loans:
Commercial and commercial real estate:
Commercial 180,924 4.22 7,643 98,620 6.12 6,034
Real estate mortgage 104,197 3.44 3,585 41,659 5.80 2,416
Real estate construction 32,961 2.94 970 19,453 5.08 988
Lease financing 14,751 9.32 1,375 7,141 5.62 401
Total commercial and commercial real estate 332,833 4.08 13,573 166,873 5.90 9,839
Consumer:
Real estate 1-4 family first mortgage 238,359 5.45 12,992 75,116 6.67 5,008
Real estate 1-4 family junior lien mortgage 106,957 4.76 5,089 75,375 6.55 4,934
Credit card 23,357 12.16 2,841 19,601 12.13 2,378
Other revolving credit and installment 90,666 6.56 5,952 54,368 8.72 4,744
Total consumer 459,339 5.85 26,874 224,460 7.60 17,064
Foreign 30,661 3.95 1,212 7,127 10.50 748
Total loans (6) 822,833 5.06 41,659 398,460 6.94 27,651
Other 6,113 3.05 186 1,920 4.73 91
Total earning assets $1,096,624 5.19% $56,993 523,482 6.69% $35,219
Funding sources
Deposits:
Interest-bearing checking $ 70,179 0.14% $ 100 5,650 1.12% $ 64
Market rate and other savings 351,892 0.39 1,375 166,691 1.32 2,195
Savings certificates 140,197 1.24 1,738 39,481 3.08 1,215
Other time deposits 20,459 2.03 415 6,656 2.83 187
Deposits in foreign offices 53,166 0.27 146 47,578 1.81 860
Total interest-bearing deposits 635,893 0.59 3,774 266,056 1.70 4,521
Short-term borrowings 51,972 0.44 231 65,826 2.25 1,478
Long-term debt 231,801 2.50 5,786 102,283 3.70 3,789
Other liabilities 4,904 3.50 172 — — —
Total interest-bearing liabilities 924,570 1.08 9,963 434,165 2.25 9,788
Portion of noninterest-bearing funding sources 172,054 — —89,317 — —
Total funding sources $1,096,624 0.91 9,963 523,482 1.86 9,788
Net interest margin and net interest income on
a taxable-equivalent basis (7) 4.28% $47,030 4.83% $25,431
Noninterest-earning assets
Cash and due from banks $ 19,218 11,175
Goodwill 23,997 13,353
Other (8) 122,515 56,386
Total noninterest-earning assets $ 165,730 80,914
Noninterest-bearing funding sources
Deposits $ 171,712 87,820
Other liabilities 48,193 28,658
Total equity 117,879 53,753
Noninterest-bearing funding sources used to
fund earning assets (172,054) (89,317)
Net noninterest-bearing funding sources $ 165,730 80,914
Total assets $1,262,354 604,396