Wells Fargo 2009 Annual Report Download - page 118
Download and view the complete annual report
Please find page 118 of the 2009 Wells Fargo annual report below. You can navigate through the pages in the report by either clicking on the pages listed below, or by using the keyword search tool below to find specific information within the annual report.-
 1
1 -
2
-
3
-
4
-
5
-
6
-
7
-
8
-
9
-
10
-
11
-
12
-
13
-
14
-
15
-
16
-
17
-
18
-
19
-
20
-
21
-
22
-
23
-
24
-
25
-
26
-
27
-
28
-
29
-
30
-
31
-
32
-
33
-
34
-
35
-
36
-
37
-
38
-
39
-
40
-
41
-
42
-
43
-
44
-
45
-
46
-
47
-
48
-
49
-
50
-
51
-
52
-
53
-
54
-
55
-
56
-
57
-
58
-
59
-
60
-
61
-
62
-
63
-
64
-
65
-
66
-
67
-
68
-
69
-
70
-
71
-
72
-
73
-
74
-
75
-
76
-
77
-
78
-
79
-
80
-
81
-
82
-
83
-
84
-
85
-
86
-
87
-
88
-
89
-
90
-
91
-
92
-
93
-
94
-
95
-
96
-
97
-
98
-
99
-
100
-
101
-
102
-
103
-
104
-
105
-
106
-
107
-
 108
108 -
 109
109 -
 110
110 -
 111
111 -
 112
112 -
 113
113 -
 114
114 -
 115
115 -
 116
116 -
 117
117 -
 118
118 -
 119
119 -
 120
120 -
 121
121 -
 122
122 -
 123
123 -
 124
124 -
 125
125 -
 126
126 -
 127
127 -
 128
128 -
129
-
130
-
131
-
132
-
133
-
134
-
135
-
136
-
137
-
138
-
139
-
140
-
141
-
142
-
143
-
144
-
145
-
146
-
147
-
148
-
149
-
150
-
151
-
152
-
153
-
154
-
155
-
156
-
157
-
158
-
159
-
160
-
161
-
162
-
163
-
164
-
165
-
166
-
167
-
168
-
169
-
170
-
171
-
172
-
173
-
174
-
175
-
176
-
177
-
178
-
179
-
180
-
181
-
182
-
183
-
184
-
185
-
186
-
187
-
188
-
189
-
190
-
191
-
192
-
193
-
194
-
195
-
196
 |
 |

Year ended December 31,
(in millions) 2009 2008 2007
Gross realized gains $ 1,601 1,920 479
Gross realized losses (1,254) (1,891) (129)
Net realized gains $ 347 29 350
(in millions) Year ended December 31, 2009
OTTI write-downs
(included in earnings)
Debt securities $1,012
Equity securities:
Marketable equity securities 82
Nonmarketable equity securities 573
Total equity securities 655
Total OTTI write-downs $1,667
OTTI on debt securities
Recorded as part of gross
realized losses:
Credit-related OTTI $ 982
Securities we intend to sell 30
Recorded directly to other
comprehensive income
for non-credit-related impairment (1) 1,340
Total OTTI on debt securities $2,352
(1) Represents amounts recorded to OCI on debt securities in periods OTTI
write-downs have occurred, which included $1.1 billion related to residential
MBS and $179 million related to commercial MBS. Changes in fair value in
subsequent periods on such securities, to the extent not subsequently
impaired in those periods, are not reflected in this balance.
Year ended December 31,
(in millions) 2009 2008
Debt securities
U.S. states and political subdivisions $7 14
Residential mortgage-backed securities 595 183
Commercial mortgage-backed securities 137 23
Corporate debt securities 69 176
Collateralized debt obligations 125 147
Other debt securities 79 3
Total debt securities 1,012 546
Marketable equity securities
Perpetual preferred securities 50 1,057
Other marketable equity securities 32 187
Total marketable equity securities 82 1,244
Total OTTI losses recognized in earnings $1,094 1,790
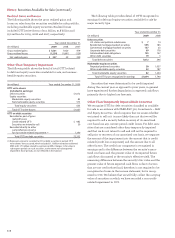
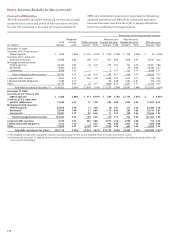
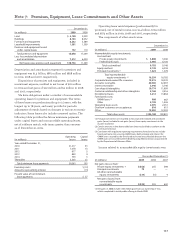
Realized Gains and Losses
The following table shows the gross realized gains and
losses on sales from the securities available-for-sale portfolio,
including marketable equity securities. Realized losses
included OTTI write-downs of $1.1 billion, $1.8 billion and
$50 million for 2009, 2008 and 2007, respectively.
Other-Than-Temporary Impairment
The following table shows the detail of total OTTI related
to debt and equity securities available for sale, and nonmar-
ketable equity securities.
The following table provides detail of OTTI recognized in
earnings for debt and equity securities available for sale by
major security type.
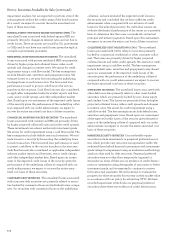
Securities that were determined to be credit impaired
during the current year as opposed to prior years, in general
have experienced further degradation in expected cash flows
primarily due to higher loss forecasts.
Other-Than-Temporarily Impaired Debt Securities
We recognize OTTI for debt securities classified as available
for sale in accordance with FASB ASC 320, Investments – Debt
and Equity Securities, which requires that we assess whether
we intend to sell or it is more likely than not that we will be
required to sell a security before recovery of its amortized
cost basis less any current-period credit losses. For debt secu-
rities that are considered other-than-temporarily impaired
and that we do not intend to sell and will not be required to
sell prior to recovery of our amortized cost basis, we separate
the amount of the impairment into the amount that is credit
related (credit loss component) and the amount due to all
other factors. The credit loss component is recognized in
earnings and is the difference between the security’s amor-
tized cost basis and the present value of its expected future
cash flows discounted at the security’s effective yield. The
remaining difference between the security’s fair value and the
present value of future expected cash flows is due to factors
that are not credit related and, therefore, is not required to be
recognized as losses in the income statement, but is recog-
nized in OCI. We believe that we will fully collect the carrying
value of securities on which we have recorded a non-credit-
related impairment in OCI.
Note 5: Securities Available for Sale (continued)