Wells Fargo 2009 Annual Report Download - page 52
Download and view the complete annual report
Please find page 52 of the 2009 Wells Fargo annual report below. You can navigate through the pages in the report by either clicking on the pages listed below, or by using the keyword search tool below to find specific information within the annual report.-
 1
1 -
2
-
3
-
4
-
5
-
6
-
7
-
8
-
9
-
10
-
11
-
12
-
13
-
14
-
15
-
16
-
17
-
18
-
19
-
20
-
21
-
22
-
23
-
24
-
25
-
26
-
27
-
28
-
29
-
30
-
31
-
32
-
33
-
34
-
35
-
36
-
37
-
38
-
39
-
40
-
41
-
 42
42 -
 43
43 -
 44
44 -
 45
45 -
 46
46 -
 47
47 -
 48
48 -
 49
49 -
 50
50 -
 51
51 -
 52
52 -
 53
53 -
 54
54 -
 55
55 -
 56
56 -
 57
57 -
 58
58 -
 59
59 -
 60
60 -
 61
61 -
 62
62 -
63
-
64
-
65
-
66
-
67
-
68
-
69
-
70
-
71
-
72
-
73
-
74
-
75
-
76
-
77
-
78
-
79
-
80
-
81
-
82
-
83
-
84
-
85
-
86
-
87
-
88
-
89
-
90
-
91
-
92
-
93
-
94
-
95
-
96
-
97
-
98
-
99
-
100
-
101
-
102
-
103
-
104
-
105
-
106
-
107
-
108
-
109
-
110
-
111
-
112
-
113
-
114
-
115
-
116
-
117
-
118
-
119
-
120
-
121
-
122
-
123
-
124
-
125
-
126
-
127
-
128
-
129
-
130
-
131
-
132
-
133
-
134
-
135
-
136
-
137
-
138
-
139
-
140
-
141
-
142
-
143
-
144
-
145
-
146
-
147
-
148
-
149
-
150
-
151
-
152
-
153
-
154
-
155
-
156
-
157
-
158
-
159
-
160
-
161
-
162
-
163
-
164
-
165
-
166
-
167
-
168
-
169
-
170
-
171
-
172
-
173
-
174
-
175
-
176
-
177
-
178
-
179
-
180
-
181
-
182
-
183
-
184
-
185
-
186
-
187
-
188
-
189
-
190
-
191
-
192
-
193
-
194
-
195
-
196
 |
 |

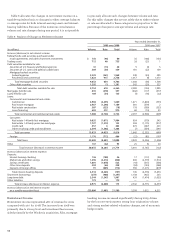
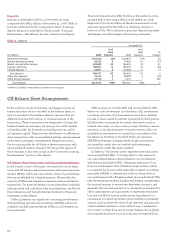
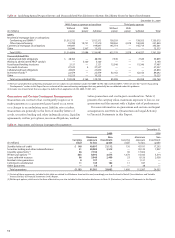
Deposits
Deposits totaled $824.0 billion at December 31, 2009,
compared with $781.4 billion at December 31, 2008. Table 14
provides additional detail. Comparative detail of average
deposit balances is provided in Table 5 under “Earnings
Performance – Net Interest Income” earlier in this Report.
Total core deposits were $780.7 billion at December 31, 2009,
up $35.3 billion from $745.4 billion at December 31, 2008.
High-rate CDs of $109 billion at Wachovia matured in 2009
and were replaced by $62 billion in checking, savings or
lower-cost CDs. We continued to gain new deposit customers
and deepen our relationships with existing customers.
Off-Balance Sheet Arrangements
In the ordinary course of business, we engage in financial
transactions that are not recorded in the balance sheet, or
may be recorded in the balance sheet in amounts that are
different from the full contract or notional amount of the
transaction. These transactions are designed to (1) meet the
financial needs of customers, (2) manage our credit, market
or liquidity risks, (3) diversify our funding sources, and/or
(4) optimize capital. These are described below as off-balance
sheet transactions with unconsolidated entities, and guarantees
and certain contingent arrangements. Beginning in 2010,
the accounting rules for off-balance sheet transactions with
unconsolidated entities changed. We discuss the impact of
those changes in this section and in the “Current Accounting
Developments” section in this Report.
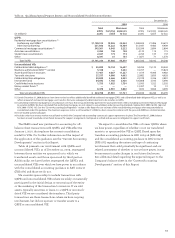
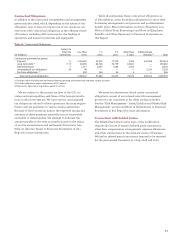
Off-Balance Sheet Transactions with Unconsolidated Entities
In the normal course of business, we enter into various types
of on- and off-balance sheet transactions with special purpose
entities (SPEs), which are corporations, trusts or partnerships
that are established for a limited purpose. Historically, the
majority of SPEs were formed in connection with securitization
transactions. For more information on securitizations, including
sales proceeds and cash flows from securitizations, see Note 8
(Securitizations and Variable Interest Entities) to Financial
Statements in this Report.
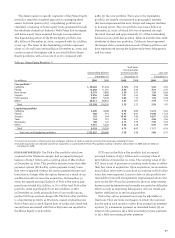
Table 15 presents our significant continuing involvement
with qualifying special purpose entities (QSPEs) and uncon-
solidated variable interest entities (VIEs) as of December 31,
2009 and 2008.
Table 15 does not include SPEs and unconsolidated VIEs
where our only involvement is in the form of (1) investments
in trading securities, (2) investments in securities available
for sale or loans issued by entities sponsored by third parties,
(3) derivative counterparty for certain derivatives such as
interest rate swaps or cross currency swaps that have custom-
ary terms or (4) administrative or trustee services. Also not
included are investments accounted for in accordance with
the American Institute of Certified Public Accountants
(AICPA) Investment Company Audit Guide, investments
accounted for under the cost method and investments
accounted for under the equity method.
In Table 15, “Total entity assets” represents the total assets
of unconsolidated SPEs. “Carrying value” is the amount in
our consolidated balance sheet related to our involvement
with the unconsolidated SPEs. “Maximum exposure to loss”
from our involvement with off-balance sheet entities, which
is a required disclosure under generally accepted accounting
principles (GAAP), is determined as the carrying value of
our involvement with off-balance sheet (unconsolidated) VIEs
plus the remaining undrawn liquidity and lending commitments,
the notional amount of net written derivative contracts, and
generally the notional amount of, or stressed loss estimate for,
other commitments and guarantees. It represents estimated
loss that would be incurred under severe, hypothetical cir-
cumstances, for which we believe the possibility is extremely
remote, such as where the value of our interests and any asso-
ciated collateral declines to zero, without any consideration
of recovery or offset from any economic hedges. Accordingly,
this required disclosure is not an indication of expected loss.
Table 14: Deposits
December 31,
% of % of
total total %
(in millions) 2009 deposits 2008 deposits Change
Noninterest-bearing $181,356 22% $150,837 19% 20
Interest-bearing checking 63,225 8 72,828 10 (13)
Market rate and other savings 402,448 49 306,255 39 31
Savings certificates 100,857 12 182,043 23 (45)
Foreign deposits (1) 32,851 4 33,469 4 (2)
Core deposits 780,737 95 745,432 95 5
Other time deposits 16,142 2 28,498 4 (43)
Other foreign deposits 27,139 3 7,472 1 263
Total deposits $824,018 100% $781,402 100% 5
(1) Reflects Eurodollar sweep balances included in core deposits.