Wells Fargo 2009 Annual Report Download - page 131
Download and view the complete annual report
Please find page 131 of the 2009 Wells Fargo annual report below. You can navigate through the pages in the report by either clicking on the pages listed below, or by using the keyword search tool below to find specific information within the annual report.-
 1
1 -
2
-
3
-
4
-
5
-
6
-
7
-
8
-
9
-
10
-
11
-
12
-
13
-
14
-
15
-
16
-
17
-
18
-
19
-
20
-
21
-
22
-
23
-
24
-
25
-
26
-
27
-
28
-
29
-
30
-
31
-
32
-
33
-
34
-
35
-
36
-
37
-
38
-
39
-
40
-
41
-
42
-
43
-
44
-
45
-
46
-
47
-
48
-
49
-
50
-
51
-
52
-
53
-
54
-
55
-
56
-
57
-
58
-
59
-
60
-
61
-
62
-
63
-
64
-
65
-
66
-
67
-
68
-
69
-
70
-
71
-
72
-
73
-
74
-
75
-
76
-
77
-
78
-
79
-
80
-
81
-
82
-
83
-
84
-
85
-
86
-
87
-
88
-
89
-
90
-
91
-
92
-
93
-
94
-
95
-
96
-
97
-
98
-
99
-
100
-
101
-
102
-
103
-
104
-
105
-
106
-
107
-
108
-
109
-
110
-
111
-
112
-
113
-
114
-
115
-
116
-
117
-
118
-
119
-
120
-
 121
121 -
 122
122 -
 123
123 -
 124
124 -
 125
125 -
 126
126 -
 127
127 -
 128
128 -
 129
129 -
 130
130 -
 131
131 -
 132
132 -
 133
133 -
 134
134 -
 135
135 -
 136
136 -
 137
137 -
 138
138 -
 139
139 -
 140
140 -
 141
141 -
142
-
143
-
144
-
145
-
146
-
147
-
148
-
149
-
150
-
151
-
152
-
153
-
154
-
155
-
156
-
157
-
158
-
159
-
160
-
161
-
162
-
163
-
164
-
165
-
166
-
167
-
168
-
169
-
170
-
171
-
172
-
173
-
174
-
175
-
176
-
177
-
178
-
179
-
180
-
181
-
182
-
183
-
184
-
185
-
186
-
187
-
188
-
189
-
190
-
191
-
192
-
193
-
194
-
195
-
196
 |
 |

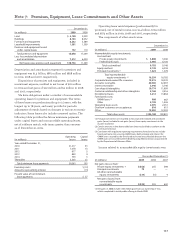
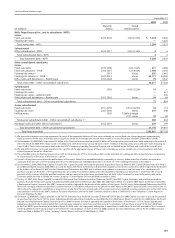
Other
Total Debt and commitments
VIE equity and Net
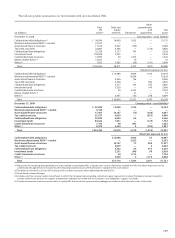
(in millions) assets(1) interests Derivatives guarantees assets
December 31, 2008 Carrying value –asset (liability)
Collateralized debt obligations (2) $ 54,294 14,080 1,053 — 15,133
Wachovia administered ABCP (3) conduit 10,767 ————
Asset-based finance structures 11,614 9,232 (136) — 9,096
Tax credit structures 22,882 4,366 — (516) 3,850
Collateralized loan obligations 23,339 3,217 109 — 3,326
Investment funds 105,808 3,543 — — 3,543
Credit-linked note structures 12,993 50 1,472 — 1,522
Money market funds (4) 13,307 — 10 — 10
Other (5) 1,832 3,983 (36) (141) 3,806
Total $ 256,836 38,471 2,472 (657) 40,286
Maximum exposure to loss
Collateralized debt obligations $ 14,080 4,849 1,514 20,443
Wachovia administered ABCP (3) conduit — 15,824 — 15,824
Asset-based finance structures 9,346 136 — 9,482
Tax credit structures 4,366 — 560 4,926
Collateralized loan obligations 3,217 109 555 3,881
Investment funds 3,550 — 140 3,690
Credit-linked note structures 50 2,253 — 2,303
Money market funds (4) —51—51
Other (5) 3,991 130 578 4,699
Total $ 38,600 23,352 3,347 65,299
December 31, 2009 Carrying value –asset (liability)
Collateralized debt obligations $ 55,899 12,988 1,746 — 14,734
Wachovia administered ABCP (3) conduit 5,160 ————
Asset-based finance structures 17,467 10,187 (72) (248) 9,867
Tax credit structures 27,537 4,659 — (653) 4,006
Collateralized loan obligations 23,830 3,602 64 — 3,666
Investment funds 84,642 1,831 — (129) 1,702
Credit-linked note structures 1,755 40 985 — 1,025
Other (5) 8,470 3,269 5 (293) 2,981
Total $224,760 36,576 2,728 (1,323) 37,981
Maximum exposure to loss
Collateralized debt obligations $12,988 3,586 33 16,607
Wachovia administered ABCP (3) conduit — 5,263 — 5,263
Asset-based finance structures 10,187 72 968 11,227
Tax credit structures 4,659 — 4 4,663
Collateralized loan obligations 3,702 64 473 4,239
Investment funds 2,331 500 89 2,920
Credit-linked note structures 40 1,714 — 1,754
Other (5) 3,269 5 1,774 5,048
Total $37,176 11,204 3,341 51,721
(1) Represents the remaining principal balance of assets held by unconsolidated VIEs using the most current information available. For VIEs that obtain exposure to assets
synthetically through derivative instruments, the remaining notional amount of the derivative is included in the asset balance.
(2) The balance of total VIE assets for VIEs involving CDOs has been revised to reflect additionally identified CDOs.
(3) Asset-based commercial paper.
(4) Includes only those money market mutual funds to which the Company had outstanding contractual support agreements in place. The balance has been revised to
exclude certain funds because the support arrangements had lapsed or settled and the Company is not obligated to support such funds.
(5) Contains investments in auction rate securities issued by VIEs that we do not sponsor and, accordingly, are unable to obtain the total assets of the entity.
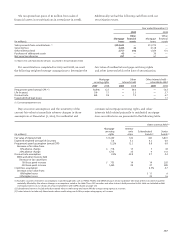
The following table summarizes our involvement with unconsolidated VIEs.