Wells Fargo 2009 Annual Report Download - page 72
Download and view the complete annual report
Please find page 72 of the 2009 Wells Fargo annual report below. You can navigate through the pages in the report by either clicking on the pages listed below, or by using the keyword search tool below to find specific information within the annual report.-
 1
1 -
2
-
3
-
4
-
5
-
6
-
7
-
8
-
9
-
10
-
11
-
12
-
13
-
14
-
15
-
16
-
17
-
18
-
19
-
20
-
21
-
22
-
23
-
24
-
25
-
26
-
27
-
28
-
29
-
30
-
31
-
32
-
33
-
34
-
35
-
36
-
37
-
38
-
39
-
40
-
41
-
42
-
43
-
44
-
45
-
46
-
47
-
48
-
49
-
50
-
51
-
52
-
53
-
54
-
55
-
56
-
57
-
58
-
59
-
60
-
61
-
 62
62 -
 63
63 -
 64
64 -
 65
65 -
 66
66 -
 67
67 -
 68
68 -
 69
69 -
 70
70 -
 71
71 -
 72
72 -
 73
73 -
 74
74 -
 75
75 -
 76
76 -
 77
77 -
 78
78 -
 79
79 -
 80
80 -
 81
81 -
 82
82 -
83
-
84
-
85
-
86
-
87
-
88
-
89
-
90
-
91
-
92
-
93
-
94
-
95
-
96
-
97
-
98
-
99
-
100
-
101
-
102
-
103
-
104
-
105
-
106
-
107
-
108
-
109
-
110
-
111
-
112
-
113
-
114
-
115
-
116
-
117
-
118
-
119
-
120
-
121
-
122
-
123
-
124
-
125
-
126
-
127
-
128
-
129
-
130
-
131
-
132
-
133
-
134
-
135
-
136
-
137
-
138
-
139
-
140
-
141
-
142
-
143
-
144
-
145
-
146
-
147
-
148
-
149
-
150
-
151
-
152
-
153
-
154
-
155
-
156
-
157
-
158
-
159
-
160
-
161
-
162
-
163
-
164
-
165
-
166
-
167
-
168
-
169
-
170
-
171
-
172
-
173
-
174
-
175
-
176
-
177
-
178
-
179
-
180
-
181
-
182
-
183
-
184
-
185
-
186
-
187
-
188
-
189
-
190
-
191
-
192
-
193
-
194
-
195
-
196
 |
 |

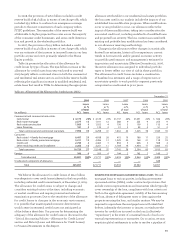
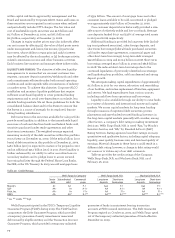
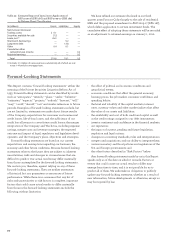
Table 30: Credit Ratings
Wells Fargo & Company Wells Fargo Bank, N.A. Wachovia Bank, N.A.
Senior Subordinated Commercial Long-term Short-term Long-term Short-term
debt debt paper deposits borrowings deposits borrowings
Moody’s A1 A2P-1 Aa2P-1 Aa2P-1
S&P AA- A+ A-1+ AA A-1+ AA A-1+
Fitch, Inc. AA- A+ F1+ AA F1+ AA F1+
DBRS AA AA* R-1** AA*** R-1*** AA*** R-1***
*low ** middle *** high
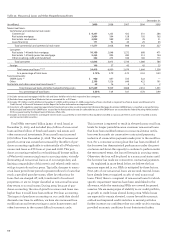
within capital risk limits approved by management and the
Board and monitored by Corporate ALCO. Gains and losses on
these securities are recognized in net income when realized
and periodically include OTTI charges. The fair value and
cost of marketable equity securities was $5.6 billion and
$4.7 billion at December 31, 2009, and $6.1 billion and
$6.3 billion, respectively, at December 31, 2008.
Changes in equity market prices may also indirectly affect
our net income by affecting (1) the value of third party assets
under management and, hence, fee income, (2) particular
borrowers, whose ability to repay principal and/or interest
may be affected by the stock market, or (3) brokerage activity,
related commission income and other business activities.
Each business line monitors and manages these indirect risks.
LIQUIDITY AND FUNDING The objective of effective liquidity
management is to ensure that we can meet customer loan
requests, customer deposit maturities/withdrawals and other
cash commitments efficiently under both normal operating
conditions and under unpredictable circumstances of industry
or market stress. To achieve this objective, Corporate ALCO
establishes and monitors liquidity guidelines that require
sufficient asset-based liquidity to cover potential funding
requirements and to avoid over-dependence on volatile, less
reliable funding markets. We set these guidelines for both the
consolidated balance sheet and for the Parent to ensure that
the Parent is a source of strength for its regulated, deposit-
taking banking subsidiaries.
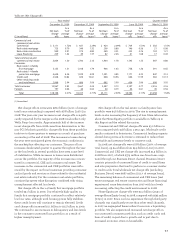
Debt securities in the securities available-for-sale portfolio
provide asset liquidity, in addition to the immediately liquid
resources of cash and due from banks and federal funds sold,
securities purchased under resale agreements and other
short-term investments. The weighted-average expected
remaining maturity of the debt securities within this portfolio
was 5.6 years at December 31, 2009. Of the $162.3 billion (cost
basis) of debt securities in this portfolio at December 31, 2009,
$48.1 billion (30%) is expected to mature or be prepaid in 2010
and an additional $25.1 billion (15%) in 2011. Asset liquidity is
further enhanced by our ability to sell or securitize loans in
secondary markets and to pledge loans to access secured
borrowing facilities through the Federal Home Loan Banks,
the FRB, or the U.S. Treasury. In 2009, we sold mortgage loans
of $394 billion. The amount of mortgage loans and other
consumer loans available to be sold, securitized or pledged
was approximately $240 billion at December 31, 2009.
Core customer deposits have historically provided a size-
able source of relatively stable and low-cost funds. Average
core deposits funded 60.4% and 53.8% of average total assets
in 2009 and 2008, respectively.
Additional funding is provided by long-term debt (includ-
ing trust preferred securities), other foreign deposits, and
short-term borrowings (federal funds purchased, securities
sold under repurchase agreements, commercial paper and
other short-term borrowings). Long-term debt averaged
$231.8 billion in 2009 and $102.3 billion in 2008. Short-term
borrowings averaged $52.0 billion in 2009 and $65.8 billion
in 2008. We reduced short-term borrowings due to the
continued liquidation of previously identified non-strategic
and liquidating loan portfolios, soft loan demand and strong
deposit growth.
We anticipate making capital expenditures of approximately
$1.1 billion in 2010 for our stores, relocation and remodeling
of our facilities, and routine replacement of furniture, equipment
and servers. We fund expenditures from various sources,
including cash flows from operations and borrowings.
Liquidity is also available through our ability to raise funds
in a variety of domestic and international money and capital
markets. We access capital markets for long-term funding
through issuances of registered debt securities, private
placements and asset-backed secured funding. Investors in
the long-term capital markets generally will consider, among
other factors, a company’s debt rating in making investment
decisions. Wells Fargo Bank, N.A. is rated “Aa2,” by Moody’s
Investors Service, and “AA,” by Standard & Poor’s (S&P)
Rating Services. Rating agencies base their ratings on many
quantitative and qualitative factors, including capital adequacy,
liquidity, asset quality, business mix, and level and quality of
earnings. Material changes in these factors could result in a
different debt rating; however, a change in debt rating would
not cause us to violate any of our debt covenants.
Table 30 provides the credit ratings of the Company,
Wells Fargo Bank, N.A. and Wachovia Bank, N.A. as of
February 26, 2010.
Wells Fargo participated in the FDIC’s Temporary Liquidity
Guarantee Program (TLGP) during 2009. The TLGP had two
components: the Debt Guarantee Program, which provided
a temporary guarantee of newly issued senior unsecured
debt issued by eligible entities; and the Transaction Account
Guarantee Program, which provided a temporary unlimited
guarantee of funds in noninterest bearing transaction
accounts at FDIC insured institutions. The Debt Guarantee
Program expired on October 31, 2009, and Wells Fargo opted
out of the temporary unlimited guarantee of funds effective
December 31, 2009.