Wells Fargo 2009 Annual Report Download - page 71
Download and view the complete annual report
Please find page 71 of the 2009 Wells Fargo annual report below. You can navigate through the pages in the report by either clicking on the pages listed below, or by using the keyword search tool below to find specific information within the annual report.-
 1
1 -
2
-
3
-
4
-
5
-
6
-
7
-
8
-
9
-
10
-
11
-
12
-
13
-
14
-
15
-
16
-
17
-
18
-
19
-
20
-
21
-
22
-
23
-
24
-
25
-
26
-
27
-
28
-
29
-
30
-
31
-
32
-
33
-
34
-
35
-
36
-
37
-
38
-
39
-
40
-
41
-
42
-
43
-
44
-
45
-
46
-
47
-
48
-
49
-
50
-
51
-
52
-
53
-
54
-
55
-
56
-
57
-
58
-
59
-
60
-
 61
61 -
 62
62 -
 63
63 -
 64
64 -
 65
65 -
 66
66 -
 67
67 -
 68
68 -
 69
69 -
 70
70 -
 71
71 -
 72
72 -
 73
73 -
 74
74 -
 75
75 -
 76
76 -
 77
77 -
 78
78 -
 79
79 -
 80
80 -
 81
81 -
82
-
83
-
84
-
85
-
86
-
87
-
88
-
89
-
90
-
91
-
92
-
93
-
94
-
95
-
96
-
97
-
98
-
99
-
100
-
101
-
102
-
103
-
104
-
105
-
106
-
107
-
108
-
109
-
110
-
111
-
112
-
113
-
114
-
115
-
116
-
117
-
118
-
119
-
120
-
121
-
122
-
123
-
124
-
125
-
126
-
127
-
128
-
129
-
130
-
131
-
132
-
133
-
134
-
135
-
136
-
137
-
138
-
139
-
140
-
141
-
142
-
143
-
144
-
145
-
146
-
147
-
148
-
149
-
150
-
151
-
152
-
153
-
154
-
155
-
156
-
157
-
158
-
159
-
160
-
161
-
162
-
163
-
164
-
165
-
166
-
167
-
168
-
169
-
170
-
171
-
172
-
173
-
174
-
175
-
176
-
177
-
178
-
179
-
180
-
181
-
182
-
183
-
184
-
185
-
186
-
187
-
188
-
189
-
190
-
191
-
192
-
193
-
194
-
195
-
196
 |
 |
change in the value of ARMs production held for sale
from changes in mortgage interest rates may or may not
be fully offset by Treasury and LIBOR index-based financial
instruments used as economic hedges for such ARMs.
Additionally, the hedge-carry income we earn on our
economic hedges for the MSRs may not continue if the
spread between short-term and long-term rates decreases.
The total carrying value of our residential and commercial
MSRs was $17.1 billion at December 31, 2009, and $16.2 billion
at December 31, 2008. The weighted-average note rate on the
owned servicing portfolio was 5.66% at December 31, 2009,
and 5.92% at December 31, 2008. Our total MSRs were 0.91%
of mortgage loans serviced for others at December 31, 2009,
compared with 0.87% at December 31, 2008.
As part of our mortgage banking activities, we enter into
commitments to fund residential mortgage loans at specified
times in the future. A mortgage loan commitment is an interest
rate lock that binds us to lend funds to a potential borrower at
a specified interest rate and within a specified period of time,
generally up to 60 days after inception of the rate lock. These
loan commitments are derivative loan commitments if the
loans that will result from the exercise of the commitments
will be held for sale. These derivative loan commitments are
recognized at fair value in the balance sheet with changes in
their fair values recorded as part of mortgage banking nonin-
terest income. The fair value of these commitments include,
at inception and during the life of the loan commitment, the
expected net future cash flows related to the associated ser-
vicing of the loan as part of the fair value measurement of
derivative loan commitments. Changes subsequent to incep-
tion are based on changes in fair value of the underlying loan
resulting from the exercise of the commitment and changes
in the probability that the loan will not fund within the terms
of the commitment, referred to as a fall-out factor. The value
of the underlying loan commitment is affected primarily by
changes in interest rates and the passage of time.
Outstanding derivative loan commitments expose us to
the risk that the price of the mortgage loans underlying the
commitments might decline due to increases in mortgage
interest rates from inception of the rate lock to the funding
of the loan. To minimize this risk, we utilize forwards and
options, Eurodollar futures, and options, and Treasury futures,
forwards and options contracts as economic hedges against
the potential decreases in the values of the loans. We expect
that these derivative financial instruments will experience
changes in fair value that will either fully or partially offset
the changes in fair value of the derivative loan commitments.
However, changes in investor demand, such as concerns
about credit risk, can also cause changes in the spread rela-
tionships between underlying loan value and the derivative
financial instruments that cannot be hedged.
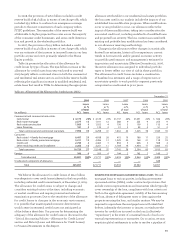
MARKET RISK – TRADING ACTIVITIES From a market risk
perspective, our net income is exposed to changes in interest
rates, credit spreads, foreign exchange rates, equity and com-
modity prices and their implied volatilities. The primary pur-
pose of our trading businesses is to accommodate customers
in the management of their market price risks. Also, we take
positions based on market expectations or to benefit from
price differences between financial instruments and markets,
subject to risk limits established and monitored by Corporate
ALCO. All securities, foreign exchange transactions, commod-
ity transactions and derivatives used in our trading business-
es are carried at fair value. The Institutional Risk Committee
establishes and monitors counterparty risk limits. The credit
risk amount and estimated net fair value of all customer
accommodation derivatives at December 31, 2009 and 2008,
are included in Note 15 (Derivatives) to Financial Statements
in this Report. Open, “at risk” positions for all trading
businesses are monitored by Corporate ALCO.
The standardized approach for monitoring and reporting
market risk for the trading activities consists of value-at-risk
(VaR) metrics complemented with factor analysis and stress
testing. VaR measures the worst expected loss over a given time
interval and within a given confidence interval. We measure
and report daily VaR at a 99% confidence interval based on
actual changes in rates and prices over the past 250 trading
days. The analysis captures all financial instruments that are
considered trading positions. The average one-day VaR through-
out 2009 was $62 million, with a lower bound of $25 million
and an upper bound of $130 million. The average VaR for
fourth quarter 2009 was $45 million with the decline from the
annual average primarily reflecting risk-reduction strategies.
MARKET RISK – EQUITY MARKETS We are directly and indirectly
affected by changes in the equity markets. We make and man-
age direct equity investments in start-up businesses, emerg-
ing growth companies, management buy-outs, acquisitions
and corporate recapitalizations. We also invest in non-affiliat-
ed funds that make similar private equity investments. These
private equity investments are made within capital allocations
approved by management and the Board of Directors (Board).
The Board’s policy is to review business developments, key
risks and historical returns for the private equity investment
portfolio at least annually. Management reviews the valua-
tions of these investments at least quarterly and assesses
them for possible OTTI. For nonmarketable investments, the
analysis is based on facts and circumstances of each individ-
ual investment and the expectations for that investment’s
cash flows and capital needs, the viability of its business
model and our exit strategy. Nonmarketable investments
included private equity investments of $3.8 billion and $3.0
billion accounted for under the cost method at December 31,
2009 and 2008, respectively, and $5.1 billion and $6.4 billion,
respectively, accounted for under the equity method. Private
equity investments are subject to OTTI. Principal investments
totaled $1.4 billion and $1.3 billion at December 31, 2009 and
2008, respectively. Principal investments are carried at fair
value with net unrealized gains and losses reported in
noninterest income.
As part of our business to support our customers, we trade
public equities, listed/OTC equity derivatives and convertible
bonds. We have risk mandates that govern these activities.
We also have marketable equity securities in the securities
available-for-sale portfolio, including securities relating to
our venture capital activities. We manage these investments