Wells Fargo 2009 Annual Report Download - page 173
Download and view the complete annual report
Please find page 173 of the 2009 Wells Fargo annual report below. You can navigate through the pages in the report by either clicking on the pages listed below, or by using the keyword search tool below to find specific information within the annual report.-
 1
1 -
2
-
3
-
4
-
5
-
6
-
7
-
8
-
9
-
10
-
11
-
12
-
13
-
14
-
15
-
16
-
17
-
18
-
19
-
20
-
21
-
22
-
23
-
24
-
25
-
26
-
27
-
28
-
29
-
30
-
31
-
32
-
33
-
34
-
35
-
36
-
37
-
38
-
39
-
40
-
41
-
42
-
43
-
44
-
45
-
46
-
47
-
48
-
49
-
50
-
51
-
52
-
53
-
54
-
55
-
56
-
57
-
58
-
59
-
60
-
61
-
62
-
63
-
64
-
65
-
66
-
67
-
68
-
69
-
70
-
71
-
72
-
73
-
74
-
75
-
76
-
77
-
78
-
79
-
80
-
81
-
82
-
83
-
84
-
85
-
86
-
87
-
88
-
89
-
90
-
91
-
92
-
93
-
94
-
95
-
96
-
97
-
98
-
99
-
100
-
101
-
102
-
103
-
104
-
105
-
106
-
107
-
108
-
109
-
110
-
111
-
112
-
113
-
114
-
115
-
116
-
117
-
118
-
119
-
120
-
121
-
122
-
123
-
124
-
125
-
126
-
127
-
128
-
129
-
130
-
131
-
132
-
133
-
134
-
135
-
136
-
137
-
138
-
139
-
140
-
141
-
142
-
143
-
144
-
145
-
146
-
147
-
148
-
149
-
150
-
151
-
152
-
153
-
154
-
155
-
156
-
157
-
158
-
159
-
160
-
161
-
162
-
 163
163 -
 164
164 -
 165
165 -
 166
166 -
 167
167 -
 168
168 -
 169
169 -
 170
170 -
 171
171 -
 172
172 -
 173
173 -
 174
174 -
 175
175 -
 176
176 -
 177
177 -
 178
178 -
 179
179 -
 180
180 -
 181
181 -
 182
182 -
 183
183 -
184
-
185
-
186
-
187
-
188
-
189
-
190
-
191
-
192
-
193
-
194
-
195
-
196
 |
 |

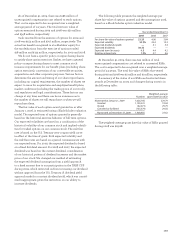
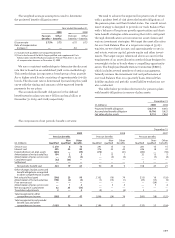
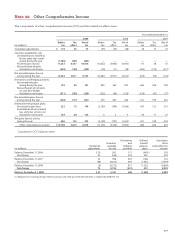
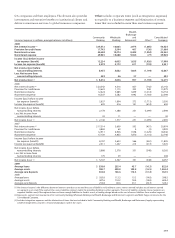
Fair Value of Plan Assets
The following table presents the balances of pension plan
December 31, 2009
(in millions) Level 1Level 2Level 3 Total
Cash and cash equivalents $ 52 515 — 567
Intermediate (core) fixed income (1) 647 1,457 9 2,113
High-yield fixed income 263 220 — 483
International fixed income — 376 — 376
Specialty fixed income —76—76
Domestic large-cap stocks (2) 1,046 630 5 1,681
Domestic mid-cap stocks 205 103 — 308
Domestic small-cap stocks (3) 867 126 — 993
International stocks (4) 354 890 1 1,245
Emerging market stocks — 653 — 653
Real estate/timber (5) 78 — 353 431
Multi-strategy hedge funds (6) — — 339 339
Private equity — 1 83 84
Other —254671
Total pension plan investments $3,512 5,072 836 9,420
Payable upon return of securities loaned (320)
Net receivables 12
Total pension plan assets $9,112
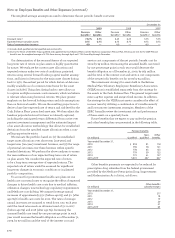
(1) This category includes assets that are primarily intermediate duration, investment grade bonds held in investment strategies benchmarked to the Barclays Capital
U.S. Aggregate Bond Index. Includes U.S. Treasury securities, agency and non-agency asset-backed bonds and corporate bonds.
(2) This category covers a broad range of investment styles, both active and passive approaches, as well as style characteristics of value, core and growth emphasized
strategies. Assets in this category are currently diversified across ten unique investment strategies. Approximately 40% of the assets within this category are passively
managed to popular mainstream market indexes including the Standard & Poor’s 500 Index; excluding the allocation to the S&P 500 Index strategy, no single investment
manager represents more than 2% of total plan assets.
(3) This category consists of a highly diversified combination of seven distinct investment management strategies with no single strategy representing more than about
2% of total plan assets. Allocations in this category are primarily spread across actively managed approaches with distinct value and growth emphasized approaches
in fairly equal proportions.
(4) This category includes assets diversified across nine unique investment strategies providing exposure to companies based primarily in developed market, non-U.S.
countries with no single strategy representing more than 2% of total plan assets.
(5) This category mostly includes investments in private and public real estate, as well as timber specific limited partnerships; real estate holdings are diversified by
geographic location and sector (e.g., retail, office, apartments).
(6) This category consists of several investment strategies managed by over 30 hedge fund managers. Single manager allocation exposure is limited to 0.15% (15 basis
points) of total plan assets.
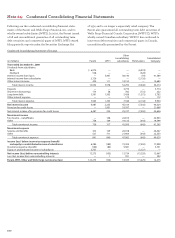
Purchases,
sales,
December 31, Gains (losses) issuances and December 31,
(in millions) 2008 Realized Unrealized(1) settlements (net) 2009
Intermediate (core) fixed income $ 5 — 1 3 9
High-yield fixed income 6 (5) — (1) —
Domestic large-cap stocks 1 — 1 3 5
International stocks — — — 1 1
Real estate/timber 433 1 (161) 80 353
Multi-strategy hedge funds 310 1 36 (8) 339
Private equity 88 — (2) (3) 83
Other 41 — (5) 10 46
$884 (3) (130) 85 836
(1) All unrealized gains (losses) relate to instruments held at period end.
The changes in Level 3 pension plan assets measured at fair value are summarized as follows:
assets measured at fair value. See Note 16 in this Report for
fair value hierarchy level definitions.