Wells Fargo 2009 Annual Report Download - page 122
Download and view the complete annual report
Please find page 122 of the 2009 Wells Fargo annual report below. You can navigate through the pages in the report by either clicking on the pages listed below, or by using the keyword search tool below to find specific information within the annual report.-
 1
1 -
2
-
3
-
4
-
5
-
6
-
7
-
8
-
9
-
10
-
11
-
12
-
13
-
14
-
15
-
16
-
17
-
18
-
19
-
20
-
21
-
22
-
23
-
24
-
25
-
26
-
27
-
28
-
29
-
30
-
31
-
32
-
33
-
34
-
35
-
36
-
37
-
38
-
39
-
40
-
41
-
42
-
43
-
44
-
45
-
46
-
47
-
48
-
49
-
50
-
51
-
52
-
53
-
54
-
55
-
56
-
57
-
58
-
59
-
60
-
61
-
62
-
63
-
64
-
65
-
66
-
67
-
68
-
69
-
70
-
71
-
72
-
73
-
74
-
75
-
76
-
77
-
78
-
79
-
80
-
81
-
82
-
83
-
84
-
85
-
86
-
87
-
88
-
89
-
90
-
91
-
92
-
93
-
94
-
95
-
96
-
97
-
98
-
99
-
100
-
101
-
102
-
103
-
104
-
105
-
106
-
107
-
108
-
109
-
110
-
111
-
 112
112 -
 113
113 -
 114
114 -
 115
115 -
 116
116 -
 117
117 -
 118
118 -
 119
119 -
 120
120 -
 121
121 -
 122
122 -
 123
123 -
 124
124 -
 125
125 -
 126
126 -
 127
127 -
 128
128 -
 129
129 -
 130
130 -
 131
131 -
 132
132 -
133
-
134
-
135
-
136
-
137
-
138
-
139
-
140
-
141
-
142
-
143
-
144
-
145
-
146
-
147
-
148
-
149
-
150
-
151
-
152
-
153
-
154
-
155
-
156
-
157
-
158
-
159
-
160
-
161
-
162
-
163
-
164
-
165
-
166
-
167
-
168
-
169
-
170
-
171
-
172
-
173
-
174
-
175
-
176
-
177
-
178
-
179
-
180
-
181
-
182
-
183
-
184
-
185
-
186
-
187
-
188
-
189
-
190
-
191
-
192
-
193
-
194
-
195
-
196
 |
 |

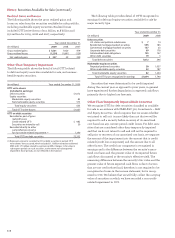
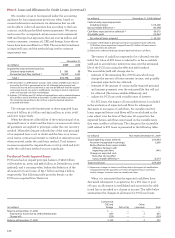
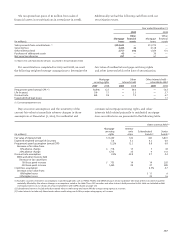
December 31,
(in millions) 2009 2008
Commercial and commercial real estate:
Commercial $187,319 195,507
Real estate mortgage 5,138 6,536
Real estate construction 9,385 19,063
Total commercial and
commercial real estate 201,842 221,106
Consumer:
Real estate 1-4 family first mortgage 33,460 36,964
Real estate 1-4 family junior lien mortgage 63,338 78,417
Credit card 65,952 75,776
Other revolving credit and installment 20,778 22,231
Total consumer 183,528 213,388
Foreign 4,468 4,817
Total unfunded loan commitments $389,838 439,311
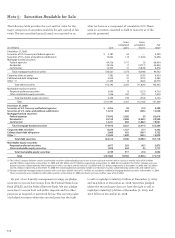
Note 6: Loans and Allowance for Credit Losses (continued)
A commitment to extend credit is a legally binding agree-
ment to lend funds to a customer, usually at a stated interest
rate and for a specified purpose. These commitments have
fixed expiration dates and generally require a fee. When we
make such a commitment, we have credit risk. The liquidity
requirements or credit risk will be lower than the contractual
amount of commitments to extend credit because a signifi-
cant portion of these commitments are expected to expire
without being used. Certain commitments are subject to loan
agreements with covenants regarding the financial perfor-
mance of the customer or borrowing base formulas that must
be met before we are required to fund the commitment. We
use the same credit policies in extending credit for unfunded
commitments and letters of credit that we use in making
loans. See Note 14 in this Report for information on standby
letters of credit.
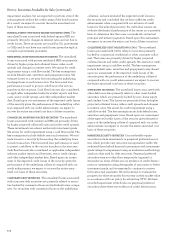
In addition, we manage the potential risk in credit commit-
ments by limiting the total amount of arrangements, both by
individual customer and in total, by monitoring the size and
maturity structure of these portfolios and by applying the
same credit standards for all of our credit activities.
The total of our unfunded loan commitments, net of all
funds lent and all standby and commercial letters of credit
issued under the terms of these commitments, is summarized
by loan category in the following table:
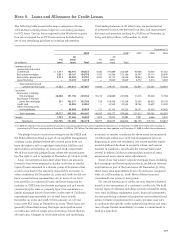
We have an established process to determine the adequacy
of the allowance for credit losses that assesses the risks and
losses inherent in our portfolio. While we attribute portions
of the allowance to specific loan categories as part of our ana-
lytical process, the entire allowance is used to absorb credit
losses inherent in the total loan portfolio.
At December 31, 2009, the portion of the allowance for
credit losses estimated at a pooled level for consumer loans
and some segments of commercial small business loans was
$16.7 billion. For purposes of determining the allowance for
credit losses, we pool certain loans in our portfolio by product
type, primarily for the auto, credit card and real estate mortgage
portfolios. To achieve greater accuracy, we further segment
selected portfolios. As appropriate, the business groups may
attempt to achieve greater accuracy through segmentation by
sub-product, origination channel, vintage, loss type, geography
and other predictive characteristics. For example, credit cards
are segmented by origination channel and the Home Equity
portfolios into liquidating and nonliquidating portfolios. In the
case of residential mortgages, we segment the liquidating Pick-
a-Pay portfolio, and further segment the remainder of the
residential mortgage portfolio based on origination channel.
To measure losses inherent in consumer loans and some
commercial small business loans, we use loss models and
other quantitative, mathematical techniques. Each business
group estimates losses for loans as of the balance sheet date
over the loss emergence period. During fourth quarter 2008,
we conformed our loss emergence period for these portfolios
to cover 12 months of estimated losses, which is within
Federal Financial Institutions Examination Council (FFIEC)
guidelines and resulted in a $2.7 billion increase to the
allowance for credit losses in 2008.
In determining the appropriate allowance attributable
to our residential real estate portfolios, the loss rates used
in our analysis include the impacts of our established loan
modification programs. When modifications occur or are
probable to occur, our allowance considers the impact of
these modifications, taking into consideration the associated
credit cost, including re-defaults of modified loans and pro-
jected loss severity. The loss content associated with existing
and probable loan modifications has been considered in our
allowance reserving methodology.
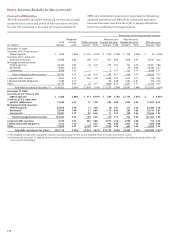
The portion of the allowance for commercial, CRE,
and foreign loans and lease financing was $8.3 billion at
December 31, 2009. We initially estimate this portion of the
allowance by applying historical loss factors statistically
derived from tracking losses associated with actual portfolio
movements over a specified period of time, for each specific
loan grade. Based on this process, we assign loss factors to
each pool of graded loans and a loan equivalent amount for
unfunded loan commitments and letters of credit. These esti-
mates are then adjusted or supplemented where necessary
from additional analysis of long-term average loss experience,
external loss data or other risks identified from current condi-
tions and trends in selected portfolios, including management’s
judgment for imprecision and uncertainty.
We also assess and account for certain nonaccrual
commercial, CRE, and foreign loan exposures that are over
$5 million and certain consumer, commercial, CRE, and for-
eign loans whose terms have been modified in a TDR as
impaired. We include the impairment on these nonperforming
loans in the allowance unless it has already been recognized as
a loss. At December 31, 2009, we included $2.8 billion in the
allowance related to these impaired loans, which is included
in other components of the allowance described above.
Reflected in the portions of the allowance previously
described is an amount for imprecision or uncertainty that
incorporates the range of probable outcomes inherent in
estimates used for the allowance, which may change from
period to period. This amount is the result of our judgment
of risks inherent in the portfolios, economic uncertainties,
historical loss experience and other subjective factors,
including industry trends, calculated to better reflect our
view of risk in each loan portfolio.