Wells Fargo 2009 Annual Report Download - page 114
Download and view the complete annual report
Please find page 114 of the 2009 Wells Fargo annual report below. You can navigate through the pages in the report by either clicking on the pages listed below, or by using the keyword search tool below to find specific information within the annual report.-
 1
1 -
2
-
3
-
4
-
5
-
6
-
7
-
8
-
9
-
10
-
11
-
12
-
13
-
14
-
15
-
16
-
17
-
18
-
19
-
20
-
21
-
22
-
23
-
24
-
25
-
26
-
27
-
28
-
29
-
30
-
31
-
32
-
33
-
34
-
35
-
36
-
37
-
38
-
39
-
40
-
41
-
42
-
43
-
44
-
45
-
46
-
47
-
48
-
49
-
50
-
51
-
52
-
53
-
54
-
55
-
56
-
57
-
58
-
59
-
60
-
61
-
62
-
63
-
64
-
65
-
66
-
67
-
68
-
69
-
70
-
71
-
72
-
73
-
74
-
75
-
76
-
77
-
78
-
79
-
80
-
81
-
82
-
83
-
84
-
85
-
86
-
87
-
88
-
89
-
90
-
91
-
92
-
93
-
94
-
95
-
96
-
97
-
98
-
99
-
100
-
101
-
102
-
103
-
 104
104 -
 105
105 -
 106
106 -
 107
107 -
 108
108 -
 109
109 -
 110
110 -
 111
111 -
 112
112 -
 113
113 -
 114
114 -
 115
115 -
 116
116 -
 117
117 -
 118
118 -
 119
119 -
 120
120 -
 121
121 -
 122
122 -
 123
123 -
 124
124 -
125
-
126
-
127
-
128
-
129
-
130
-
131
-
132
-
133
-
134
-
135
-
136
-
137
-
138
-
139
-
140
-
141
-
142
-
143
-
144
-
145
-
146
-
147
-
148
-
149
-
150
-
151
-
152
-
153
-
154
-
155
-
156
-
157
-
158
-
159
-
160
-
161
-
162
-
163
-
164
-
165
-
166
-
167
-
168
-
169
-
170
-
171
-
172
-
173
-
174
-
175
-
176
-
177
-
178
-
179
-
180
-
181
-
182
-
183
-
184
-
185
-
186
-
187
-
188
-
189
-
190
-
191
-
192
-
193
-
194
-
195
-
196
 |
 |

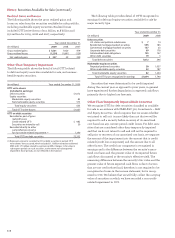
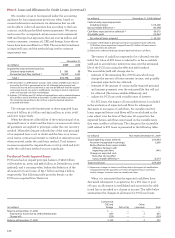
As part of our liquidity management strategy, we pledge
securities to secure borrowings from the Federal Home Loan
Bank (FHLB) and the Federal Reserve Bank. We also pledge
securities to secure trust and public deposits and for other
purposes as required or permitted by law. The carrying value
of pledged securities where the secured party has the right
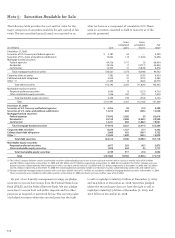
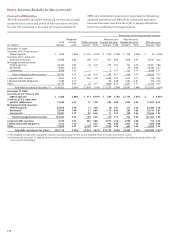
The following table provides the cost and fair value for the
major categories of securities available for sale carried at fair
value. The net unrealized gains (losses) are reported on an
Note 5: Securities Available for Sale
after tax basis as a component of cumulative OCI. There
were no securities classified as held to maturity as of the
periods presented.
to sell or repledge totaled $5.0 billion at December 31, 2009,
and $4.5 billion at December 31, 2008. Securities pledged
where the secured party does not have the right to sell or
repledge totaled $93.9 billion at December 31, 2009, and
$71.6 billion at December 31, 2008.
Gross Gross
unrealized unrealized Fair
(in millions) Cost gains losses value
December 31, 2008
Securities of U.S. Treasury and federal agencies $ 3,187 62 — 3,249
Securities of U.S. states and political subdivisions 14,062 116 (1,520) 12,658
Mortgage-backed securities:
Federal agencies 64,726 1,711 (3) 66,434
Residential 29,536 11 (4,717) 24,830
Commercial 12,305 51 (3,878) 8,478
Total mortgage-backed securities 106,567 1,773 (8,598) 99,742
Corporate debt securities 7,382 81 (539) 6,924
Collateralized debt obligations 2,634 21 (570) 2,085
Other (1)(2) 21,363 14 (602) 20,775
Total debt securities 155,195 2,067 (11,829) 145,433
Marketable equity securities:
Perpetual preferred securities 5,040 13 (327) 4,726
Other marketable equity securities 1,256 181 (27) 1,410
Total marketable equity securities 6,296 194 (354) 6,136
Total $ 161,491 2,261 (12,183) 151,569
December 31, 2009
Securities of U.S. Treasury and federal agencies $ 2,256 38 (14) 2,280
Securities of U.S. states and political subdivisions 13,212 683 (365) 13,530
Mortgage-backed securities:
Federal agencies 79,542 3,285 (9) 82,818
Residential (2) 28,153 2,480 (2,043) 28,590
Commercial 12,221 602 (1,862) 10,961
Total mortgage-backed securities 119,916 6,367 (3,914) 122,369
Corporate debt securities 8,245 1,167 (77) 9,335
Collateralized debt obligations 3,660 432 (367) 3,725
Other (1) 15,025 1,099 (245) 15,879
Total debt securities 162,314 9,786 (4,982) 167,118
Marketable equity securities:
Perpetual preferred securities 3,677 263 (65) 3,875
Other marketable equity securities 1,072 654 (9) 1,717
Total marketable equity securities 4,749 917 (74) 5,592
Total $167,063 10,703 (5,056) 172,710
(1) The “Other” category includes certain asset-backed securities collateralized by auto leases or loans and cash reserves with a cost basis and fair value of $8.2 billion
and $8.5 billion, respectively, at December 31, 2009, and $8.3 billion and $7.9 billion, respectively, at December 31, 2008. Also included in the “Other” category are asset-
backed securities collateralized by home equity loans with a cost basis and fair value of $2.3 billion and $2.5 billion, respectively, at December 31, 2009, and $3.2 billion
and $3.2 billion, respectively, at December 31, 2008. The remaining balances primarily include asset-backed securities collateralized by credit cards and student loans.
(2) Foreign residential mortgage-backed securities with a cost basis and fair value of $51 million are included in residential mortgage-backed securities at December 31, 2009.
These instruments were included in other debt securities at December 31, 2008, and had a cost basis and fair value of $6.3 billion.