Wells Fargo 2009 Annual Report Download - page 47
Download and view the complete annual report
Please find page 47 of the 2009 Wells Fargo annual report below. You can navigate through the pages in the report by either clicking on the pages listed below, or by using the keyword search tool below to find specific information within the annual report.-
 1
1 -
2
-
3
-
4
-
5
-
6
-
7
-
8
-
9
-
10
-
11
-
12
-
13
-
14
-
15
-
16
-
17
-
18
-
19
-
20
-
21
-
22
-
23
-
24
-
25
-
26
-
27
-
28
-
29
-
30
-
31
-
32
-
33
-
34
-
35
-
36
-
 37
37 -
 38
38 -
 39
39 -
 40
40 -
 41
41 -
 42
42 -
 43
43 -
 44
44 -
 45
45 -
 46
46 -
 47
47 -
 48
48 -
 49
49 -
 50
50 -
 51
51 -
 52
52 -
 53
53 -
 54
54 -
 55
55 -
 56
56 -
 57
57 -
58
-
59
-
60
-
61
-
62
-
63
-
64
-
65
-
66
-
67
-
68
-
69
-
70
-
71
-
72
-
73
-
74
-
75
-
76
-
77
-
78
-
79
-
80
-
81
-
82
-
83
-
84
-
85
-
86
-
87
-
88
-
89
-
90
-
91
-
92
-
93
-
94
-
95
-
96
-
97
-
98
-
99
-
100
-
101
-
102
-
103
-
104
-
105
-
106
-
107
-
108
-
109
-
110
-
111
-
112
-
113
-
114
-
115
-
116
-
117
-
118
-
119
-
120
-
121
-
122
-
123
-
124
-
125
-
126
-
127
-
128
-
129
-
130
-
131
-
132
-
133
-
134
-
135
-
136
-
137
-
138
-
139
-
140
-
141
-
142
-
143
-
144
-
145
-
146
-
147
-
148
-
149
-
150
-
151
-
152
-
153
-
154
-
155
-
156
-
157
-
158
-
159
-
160
-
161
-
162
-
163
-
164
-
165
-
166
-
167
-
168
-
169
-
170
-
171
-
172
-
173
-
174
-
175
-
176
-
177
-
178
-
179
-
180
-
181
-
182
-
183
-
184
-
185
-
186
-
187
-
188
-
189
-
190
-
191
-
192
-
193
-
194
-
195
-
196
 |
 |

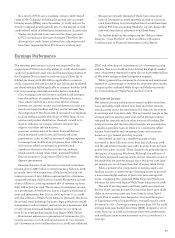
Effective January 1, 2009, we adopted new accounting
guidance that changed the way noncontrolling interests are
presented in the income statement such that the consolidated
income statement includes amounts from both Wells Fargo
interests and the noncontrolling interests. As a result, our
effective tax rate is calculated by dividing income tax expense
by income before income tax expense less the net income
from noncontrolling interests.
Operating Segment Results
We define our operating segments by product and customer.
As a result of the combination of Wells Fargo and Wachovia,
in 2009 management realigned our business segments into
three lines of business: Community Banking; Wholesale
Banking; and Wealth, Brokerage and Retirement. Our man-
agement accounting process measures the performance of the
operating segments based on our management structure and
is not necessarily comparable with similar information for
other financial services companies. We revised prior period
information to reflect the 2009 realignment of our operating
segments; however, because the acquisition was completed
on December 31, 2008, Wachovia’s results are not included in
the income statement or in average balances for periods prior
to 2009. The Wachovia acquisition was material to us, and the
inclusion of results from Wachovia’s businesses in our 2009
financial statements is a material factor in the changes in
our results compared with prior year results. The significant
matters affecting our financial results for 2009 have been
discussed previously. Table 9 and the following discussion
present our results by operating segment. For a more
complete description of our operating segments, including
additional financial information and the underlying manage-
ment accounting process, see Note 23 (Operating Segments)
to Financial Statements in this Report.
Community Banking offers a complete line of diversified
financial products and services for consumers and small
businesses including investment, insurance and trust services
in 39 states and D.C., and mortgage and home equity loans
in all 50 states and D.C. Wachovia added expanded product
capability as well as expanded channels to better serve our
customers. Community Banking includes Wells Fargo Financial.
Revenue growth for 2009 was driven primarily by signifi-
cant growth in mortgage originations ($420 billion in 2009
compared with $230 billion in prior year) and strong mort-
gage servicing hedge results (primarily due to hedge carry
income arising from the low short-term interest rates) as well
as continued success in the cross-sell of Wells Fargo products.
Double-digit growth in legacy Wells Fargo core deposits and
the ability to retain approximately 60% of Wachovia’s matured
higher-cost CDs portfolio in lower-rate CDs and liquid
deposits at lower than expected yields also contributed to the
growth, mitigated by lower loan interest rates. Noninterest
expense increased from 2008 due to the addition of Wachovia,
increases in FDIC and other deposit assessments, and credit
related expenses, including the addition of resources to han-
dle a higher volume of mortgage loan modifications. To bene-
fit our customers we continued to invest in adding sales and
service team members in regional banking as we aligned
Wachovia banking stores with the Wells Fargo model. The
increases in noninterest expense were mitigated by continued
revenue growth and expense management as we stayed on
track to meet our merger synergy goals.
Wholesale Banking provides financial solutions to businesses
across the United States with annual sales generally in excess
of $10 million and to financial institutions globally. Products
include middle market banking, corporate banking, CRE, trea-
sury management, asset-based lending, insurance brokerage,
foreign exchange, correspondent banking, trade services,
specialized lending, equipment finance, corporate trust,
investment banking, capital markets, and asset management.
Wachovia added expanded product capabilities across the
segment, including investment banking, mergers and acquisi-
tions, equity trading, equity structured products, fixed-income
sales and trading, and equity and fixed-income research.
Wholesale Banking earned net income of $3.9 billion and
revenue of $20.3 billion in 2009. Results were driven by the
performance of our many diverse businesses, such as com-
mercial banking, corporate banking, asset-based lending,
asset management, investment banking and international.
With over 750 offices nationwide and globally, plus expanded
product and distribution capabilities, Wholesale Banking saw
gains in 2009 in the number of new middle market companies
we lent money to and in the positive experiences those com-
panies had with our bank. Revenue performance also benefited
from the recovery of the capital markets. We saw the effect
of customers deleveraging, accessing capital markets and
delaying investment decisions as loan balances declined
throughout the year; however, we continued to originate loans
at improved spreads and terms. The provision for loan losses
was $3.6 billion, including $1.2 billion of additional provision
to build reserves for the wholesale portfolio.
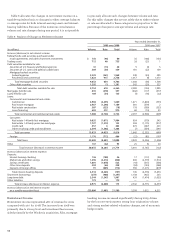
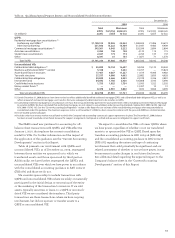
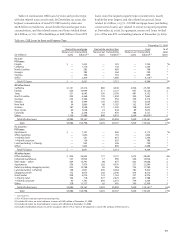
Table 9: Operating Segment Results – Highlights
Wealth, Brokerage
Community Banking Wholesale Banking and Retirement
(in billions) 2009 2008 2009 2008 2009 2008
Revenue $ 59.0 33.0 20.3 8.2 11.5 2.7
Net income 8.6 2.1 3.9 1.4 1.0 0.2
Average loans 538.0 285.6 255.4 112.3 45.7 15.2
Average core deposits 533.0 252.8 146.6 69.6 114.3 23.1