Wells Fargo 2009 Annual Report Download - page 6
Download and view the complete annual report
Please find page 6 of the 2009 Wells Fargo annual report below. You can navigate through the pages in the report by either clicking on the pages listed below, or by using the keyword search tool below to find specific information within the annual report.-
 1
1 -
 2
2 -
 3
3 -
 4
4 -
 5
5 -
 6
6 -
 7
7 -
 8
8 -
 9
9 -
 10
10 -
 11
11 -
 12
12 -
 13
13 -
 14
14 -
 15
15 -
 16
16 -
 17
17 -
18
-
19
-
20
-
21
-
22
-
23
-
24
-
25
-
26
-
27
-
28
-
29
-
30
-
31
-
32
-
33
-
34
-
35
-
36
-
37
-
38
-
39
-
40
-
41
-
42
-
43
-
44
-
45
-
46
-
47
-
48
-
49
-
50
-
51
-
52
-
53
-
54
-
55
-
56
-
57
-
58
-
59
-
60
-
61
-
62
-
63
-
64
-
65
-
66
-
67
-
68
-
69
-
70
-
71
-
72
-
73
-
74
-
75
-
76
-
77
-
78
-
79
-
80
-
81
-
82
-
83
-
84
-
85
-
86
-
87
-
88
-
89
-
90
-
91
-
92
-
93
-
94
-
95
-
96
-
97
-
98
-
99
-
100
-
101
-
102
-
103
-
104
-
105
-
106
-
107
-
108
-
109
-
110
-
111
-
112
-
113
-
114
-
115
-
116
-
117
-
118
-
119
-
120
-
121
-
122
-
123
-
124
-
125
-
126
-
127
-
128
-
129
-
130
-
131
-
132
-
133
-
134
-
135
-
136
-
137
-
138
-
139
-
140
-
141
-
142
-
143
-
144
-
145
-
146
-
147
-
148
-
149
-
150
-
151
-
152
-
153
-
154
-
155
-
156
-
157
-
158
-
159
-
160
-
161
-
162
-
163
-
164
-
165
-
166
-
167
-
168
-
169
-
170
-
171
-
172
-
173
-
174
-
175
-
176
-
177
-
178
-
179
-
180
-
181
-
182
-
183
-
184
-
185
-
186
-
187
-
188
-
189
-
190
-
191
-
192
-
193
-
194
-
195
-
196
 |
 |

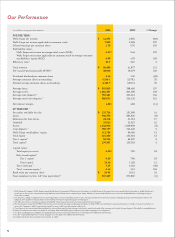
Our Performance
inmillionsexceptpershareamounts Change
FORTHEYEAR
WellsFargonetincome
WellsFargonetincomeapplicabletocommonstock
Dilutedearningspercommonshare
Profi tabilityratios
WellsFargonetincometoaveragetotalassets(ROA)
WellsFargonetincomeapplicabletocommonstocktoaveragecommon
stockholders’equity(ROE)
E ciencyratio
Totalrevenue
Pretaxpreprovisionprofi t(PTPP)
Dividendsdeclaredpercommonshare ()
Averagecommonsharesoutstanding
Dilutedaveragecommonsharesoutstanding
Averageloans
Averageassets
Averagecoredeposits
Averageretailcoredeposits
Netinterestmargin ()
ATYEAREND
Securitiesavailableforsale
Loans ()
Allowanceforloanlosses
Goodwill
Assets ()
Coredeposits
WellsFargostockholders’equity
Totalequity
Tiercapital
Totalcapital
Capitalratios
Totalequitytoassets
Riskbasedcapital
Tiercapital
Totalcapital
Tierleverage ()
Tiercommonequity
Bookvaluepercommonshare
Teammembers(activefulltimeequivalent) ()
1 Wells Fargo & Company (Wells Fargo) acquired Wachovia Corporation (Wachovia) on December 31, 2008. Because the acquisition was completed on December 31, 2008, Wachovia’s
results are in the income statement, average balances and related metrics beginning in 2009. Wachovia’s assets and liabilities are in the consolidated balance sheet beginning on
December 31, 2008.
2 On January 1, 2009, we adopted new accounting guidance on noncontrolling interests on a retrospective basis for disclosure and, accordingly, prior period information refl ects the
adoption. The guidance requires that noncontrolling interests be reported as part of total equity.
3 The e ciency ratio is noninterest expense divided by total revenue (net interest income and noninterest income).
4 Pre-tax pre-provision profi t (PTPP) is total revenue less noninterest expense. Management believes that PTPP is a useful fi nancial measure because it enables investors and others to
assess the Company’s ability to generate capital to cover credit losses through a credit cycle.
5 Core deposits are noninterest-bearing deposits, interest-bearing checking, savings certifi cates, market rate and other savings, and certain foreign deposits (Eurodollar sweep balances).
6 Retail core deposits are total core deposits excluding Wholesale Banking core deposits and retail mortgage escrow deposits.
7 See Note 25 (Regulatory and Agency Capital Requirements) to Financial Statements in this Report for additional information.
8 See the “Capital Management” section on page 71 in this Report for additional information.
9 Includes Wachovia team members at December 31, 2008.