Wells Fargo 2009 Annual Report Download - page 93
Download and view the complete annual report
Please find page 93 of the 2009 Wells Fargo annual report below. You can navigate through the pages in the report by either clicking on the pages listed below, or by using the keyword search tool below to find specific information within the annual report.-
 1
1 -
2
-
3
-
4
-
5
-
6
-
7
-
8
-
9
-
10
-
11
-
12
-
13
-
14
-
15
-
16
-
17
-
18
-
19
-
20
-
21
-
22
-
23
-
24
-
25
-
26
-
27
-
28
-
29
-
30
-
31
-
32
-
33
-
34
-
35
-
36
-
37
-
38
-
39
-
40
-
41
-
42
-
43
-
44
-
45
-
46
-
47
-
48
-
49
-
50
-
51
-
52
-
53
-
54
-
55
-
56
-
57
-
58
-
59
-
60
-
61
-
62
-
63
-
64
-
65
-
66
-
67
-
68
-
69
-
70
-
71
-
72
-
73
-
74
-
75
-
76
-
77
-
78
-
79
-
80
-
81
-
82
-
 83
83 -
 84
84 -
 85
85 -
 86
86 -
 87
87 -
 88
88 -
 89
89 -
 90
90 -
 91
91 -
 92
92 -
 93
93 -
 94
94 -
 95
95 -
 96
96 -
 97
97 -
 98
98 -
 99
99 -
 100
100 -
 101
101 -
 102
102 -
 103
103 -
104
-
105
-
106
-
107
-
108
-
109
-
110
-
111
-
112
-
113
-
114
-
115
-
116
-
117
-
118
-
119
-
120
-
121
-
122
-
123
-
124
-
125
-
126
-
127
-
128
-
129
-
130
-
131
-
132
-
133
-
134
-
135
-
136
-
137
-
138
-
139
-
140
-
141
-
142
-
143
-
144
-
145
-
146
-
147
-
148
-
149
-
150
-
151
-
152
-
153
-
154
-
155
-
156
-
157
-
158
-
159
-
160
-
161
-
162
-
163
-
164
-
165
-
166
-
167
-
168
-
169
-
170
-
171
-
172
-
173
-
174
-
175
-
176
-
177
-
178
-
179
-
180
-
181
-
182
-
183
-
184
-
185
-
186
-
187
-
188
-
189
-
190
-
191
-
192
-
193
-
194
-
195
-
196
 |
 |

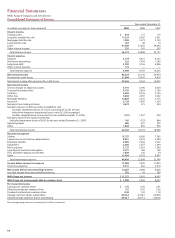
Wells Fargo & Company and Subsidiaries
Consolidated Balance Sheet
December 31,
(in millions, except shares) 2009 2008
Assets
Cash and due from banks $ 27,080 23,763
Federal funds sold, securities purchased under
resale agreements and other short-term investments 40,885 49,433
Trading assets 43,039 54,884
Securities available for sale 172,710 151,569
Mortgages held for sale (includes $36,962 and $18,754 carried at fair value) 39,094 20,088
Loans held for sale (includes $149 and $398 carried at fair value) 5,733 6,228
Loans 782,770 864,830
Allowance for loan losses (24,516) (21,013)
Net loans 758,254 843,817
Mortgage servicing rights:
Measured at fair value (residential MSRs) 16,004 14,714
Amortized 1,119 1,446
Premises and equipment, net 10,736 11,269
Goodwill 24,812 22,627
Other assets 104,180 109,801
Total assets $1,243,646 1,309,639
Liabilities
Noninterest-bearing deposits $ 181,356 150,837
Interest-bearing deposits 642,662 630,565
Total deposits 824,018 781,402
Short-term borrowings 38,966 108,074
Accrued expenses and other liabilities 62,442 50,689
Long-term debt 203,861 267,158
Total liabilities 1,129,287 1,207,323
Equity
Wells Fargo stockholders’ equity:
Preferred stock 8,485 31,332
Common stock – $12/3par value, authorized 6,000,000,000 shares;
issued 5,245,971,422 shares and 4,363,921,429 shares 8,743 7,273
Additional paid-in capital 52,878 36,026
Retained earnings 41,563 36,543
Cumulative other comprehensive income (loss) 3,009 (6,869)
Treasury stock – 67,346,829 shares and 135,290,540 shares (2,450) (4,666)
Unearned ESOP shares (442) (555)
Total Wells Fargo stockholders’ equity 111,786 99,084
Noncontrolling interests 2,573 3,232
Total equity 114,359 102,316
Total liabilities and equity $1,243,646 1,309,639
The accompanying notes are an integral part of these statements.