Wells Fargo 2009 Annual Report Download - page 61
Download and view the complete annual report
Please find page 61 of the 2009 Wells Fargo annual report below. You can navigate through the pages in the report by either clicking on the pages listed below, or by using the keyword search tool below to find specific information within the annual report.-
 1
1 -
2
-
3
-
4
-
5
-
6
-
7
-
8
-
9
-
10
-
11
-
12
-
13
-
14
-
15
-
16
-
17
-
18
-
19
-
20
-
21
-
22
-
23
-
24
-
25
-
26
-
27
-
28
-
29
-
30
-
31
-
32
-
33
-
34
-
35
-
36
-
37
-
38
-
39
-
40
-
41
-
42
-
43
-
44
-
45
-
46
-
47
-
48
-
49
-
50
-
 51
51 -
 52
52 -
 53
53 -
 54
54 -
 55
55 -
 56
56 -
 57
57 -
 58
58 -
 59
59 -
 60
60 -
 61
61 -
 62
62 -
 63
63 -
 64
64 -
 65
65 -
 66
66 -
 67
67 -
 68
68 -
 69
69 -
 70
70 -
 71
71 -
72
-
73
-
74
-
75
-
76
-
77
-
78
-
79
-
80
-
81
-
82
-
83
-
84
-
85
-
86
-
87
-
88
-
89
-
90
-
91
-
92
-
93
-
94
-
95
-
96
-
97
-
98
-
99
-
100
-
101
-
102
-
103
-
104
-
105
-
106
-
107
-
108
-
109
-
110
-
111
-
112
-
113
-
114
-
115
-
116
-
117
-
118
-
119
-
120
-
121
-
122
-
123
-
124
-
125
-
126
-
127
-
128
-
129
-
130
-
131
-
132
-
133
-
134
-
135
-
136
-
137
-
138
-
139
-
140
-
141
-
142
-
143
-
144
-
145
-
146
-
147
-
148
-
149
-
150
-
151
-
152
-
153
-
154
-
155
-
156
-
157
-
158
-
159
-
160
-
161
-
162
-
163
-
164
-
165
-
166
-
167
-
168
-
169
-
170
-
171
-
172
-
173
-
174
-
175
-
176
-
177
-
178
-
179
-
180
-
181
-
182
-
183
-
184
-
185
-
186
-
187
-
188
-
189
-
190
-
191
-
192
-
193
-
194
-
195
-
196
 |
 |
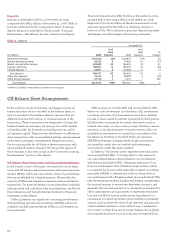
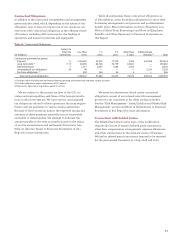
To maximize return and allow flexibility for customers to
avoid foreclosure, we have in place several loss mitigation
strategies for our Pick-a-Pay loan portfolio. We contact cus-
tomers who are experiencing difficulty and may in certain
cases modify the terms of a loan based on a customer’s docu-
mented income and other circumstances. We also are actively
modifying the Pick-a-Pay portfolio. Because of the write-down
of the PCI loans in purchase accounting, which have been
aggregated in pools, our post merger modifications to PCI
Pick-a-Pay loans have not resulted in any modification-related
provision for credit losses. To the extent we modify loans not
in the PCI Pick-a-Pay portfolio, we establish an impairment
reserve in accordance with the applicable accounting require-
ments for loan restructurings.
We also have taken steps to work with customers to refi-
nance or restructure their Pick-a-Pay loans into other loan
products. For customers at risk, we offer combinations of term
extensions of up to 40 years (from 30 years), interest rate
reductions, to charge no interest on a portion of the principal
for some period of time and, in geographies with substantial
property value declines, we will even offer permanent princi-
pal reductions. In 2009, we completed over 52,000 Pick-a-Pay
loan modifications. The majority of the loan modifications
were concentrated in our PCI Pick-a-Pay loan portfolio.
Approximately 31% of the PCI portfolio was modified in 2009.
Nearly 70,000 modification offers were proactively sent to
customers during 2009. As part of the modification process,
the loans are re-underwritten, income is documented and the
negative amortization feature is eliminated. Most of the modi-
fications result in material payment reduction to the cus-
tomer. We continually reassess our loss mitigation strategies
and may adopt additional or different strategies in the future.
In fourth quarter 2009, the U.S. Treasury Department’s Home
Affordable Modification Program (HAMP) was rolled out to
the customers in this portfolio. As of December 31, 2009, over
45,000 HAMP applications were being reviewed by our loan
servicing department. We believe a key factor to successful
loss mitigation is tailoring the revised loan payment to the
customer’s sustainable income.
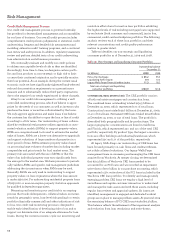
CREDIT CARDS Our credit card portfolio, a portion of which
is included in the Wells Fargo Financial discussion below,
totaled $24.0 billion at December 31, 2009, which represents
only 3% of our total outstanding loans and is smaller than
the credit card portfolios of each of our large bank peers.
Delinquencies of 30 days or more were 5.5% of credit card
outstandings at December 31, 2009, up from 5.0% a year ago.
Net charge-offs were 10.8% for 2009, up from 7.2% in 2008,
reflecting high bankruptcy filings and the current economic
environment. We have tightened underwriting criteria and
imposed credit line management changes to minimize
balance transfers and line increases.
WELLS FARGO FINANCIAL Wells Fargo Financial’s portfolio
consists of real estate loans, substantially all of which are
secured debt consolidation loans, and both prime and non-
prime auto secured loans, unsecured loans and credit cards.
Wells Fargo Financial had $25.8 billion and $29.1 billion
in real estate secured loans at December 31, 2009 and 2008,
respectively. Of this portfolio, $1.6 billion and $1.8 billion,
respectively, was considered prime based on secondary market
standards and has been priced to the customer accordingly.
The remaining portfolio is non-prime but has been originated
with standards to reduce credit risk. These loans were originated
through our retail channel with documented income, LTV
limits based on credit quality and property characteristics,
and risk-based pricing. In addition, the loans were originated
without teaser rates, interest-only or negative amortization
features. Credit losses in the portfolio have increased in the
current economic environment compared with historical levels,
but performance remained similar to prime portfolios in the
industry with overall loss rates of 3.13% in 2009 on the entire
portfolio. At December 31, 2009, $8.4 billion of the portfolio
was originated with customer FICO scores below 620, but
these loans have further restrictions on LTV and debt-to-
income ratios intended to limit the credit risk.
Wells Fargo Financial also had $16.5 billion and $23.6 bil-
lion in auto secured loans and leases at December 31, 2009
and 2008, respectively, of which $4.4 billion and $6.3 billion,
respectively, were originated with customer FICO scores
below 620. Loss rates in this portfolio in 2009 were 5.12% for
FICO scores of 620 and above, and 7.00% for FICO scores
below 620. These loans were priced based on relative risk.
Of this portfolio, $11.3 billion represented loans and leases
originated through its indirect auto business, a channel
Wells Fargo Financial ceased using near the end of 2008.
Wells Fargo Financial had $8.1 billion and $8.4 billion in
unsecured loans and credit card receivables at December 31,
2009 and 2008, respectively, of which $1.0 billion and $1.3 bil-
lion, respectively, was originated with customer FICO scores
below 620. Net loss rates in this portfolio were 13.35% in 2009
for FICO scores of 620 and above, and 19.78% for FICO scores
below 620. Wells Fargo Financial has been actively tightening
credit policies and managing credit lines to reduce exposure
given current economic conditions.
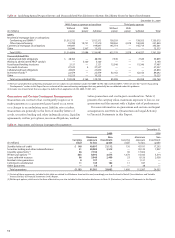
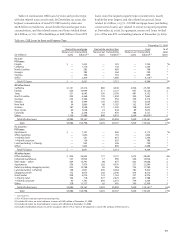
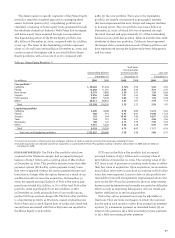
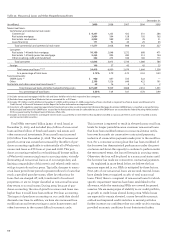
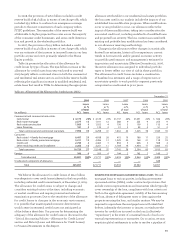
NONACCRUAL LOANS AND OTHER NONPERFORMING ASSETS
Table 25 shows the five-year trend for nonaccrual loans and
other NPAs. We generally place loans on nonaccrual status
when:
• the full and timely collection of interest or principal
becomes uncertain;
• they are 90 days (120 days with respect to real estate 1-4
family first and junior lien mortgages and auto loans) past
due for interest or principal (unless both well-secured and
in the process of collection); or
• part of the principal balance has been charged off and no
restructuring has occurred.
Note 1 (Summary of Significant Accounting Policies –
Loans) to Financial Statements in this Report describes our
accounting policy for nonaccrual loans.