Wells Fargo 2009 Annual Report Download - page 75
Download and view the complete annual report
Please find page 75 of the 2009 Wells Fargo annual report below. You can navigate through the pages in the report by either clicking on the pages listed below, or by using the keyword search tool below to find specific information within the annual report.-
 1
1 -
2
-
3
-
4
-
5
-
6
-
7
-
8
-
9
-
10
-
11
-
12
-
13
-
14
-
15
-
16
-
17
-
18
-
19
-
20
-
21
-
22
-
23
-
24
-
25
-
26
-
27
-
28
-
29
-
30
-
31
-
32
-
33
-
34
-
35
-
36
-
37
-
38
-
39
-
40
-
41
-
42
-
43
-
44
-
45
-
46
-
47
-
48
-
49
-
50
-
51
-
52
-
53
-
54
-
55
-
56
-
57
-
58
-
59
-
60
-
61
-
62
-
63
-
64
-
 65
65 -
 66
66 -
 67
67 -
 68
68 -
 69
69 -
 70
70 -
 71
71 -
 72
72 -
 73
73 -
 74
74 -
 75
75 -
 76
76 -
 77
77 -
 78
78 -
 79
79 -
 80
80 -
 81
81 -
 82
82 -
 83
83 -
 84
84 -
 85
85 -
86
-
87
-
88
-
89
-
90
-
91
-
92
-
93
-
94
-
95
-
96
-
97
-
98
-
99
-
100
-
101
-
102
-
103
-
104
-
105
-
106
-
107
-
108
-
109
-
110
-
111
-
112
-
113
-
114
-
115
-
116
-
117
-
118
-
119
-
120
-
121
-
122
-
123
-
124
-
125
-
126
-
127
-
128
-
129
-
130
-
131
-
132
-
133
-
134
-
135
-
136
-
137
-
138
-
139
-
140
-
141
-
142
-
143
-
144
-
145
-
146
-
147
-
148
-
149
-
150
-
151
-
152
-
153
-
154
-
155
-
156
-
157
-
158
-
159
-
160
-
161
-
162
-
163
-
164
-
165
-
166
-
167
-
168
-
169
-
170
-
171
-
172
-
173
-
174
-
175
-
176
-
177
-
178
-
179
-
180
-
181
-
182
-
183
-
184
-
185
-
186
-
187
-
188
-
189
-
190
-
191
-
192
-
193
-
194
-
195
-
196
 |
 |

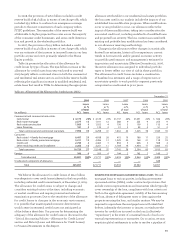
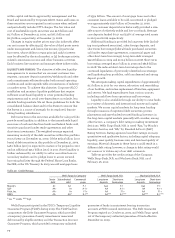
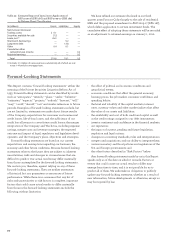
Table 31: Tier Common Equity (1)
December 31,
(in billions) 2009 2008
Total equity $ 114.4 102.3
Less: Noncontrolling interests (2.6) (3.2)
Total Wells Fargo stockholders’ equity 111.8 99.1
Less: Preferred equity (8.1) (30.8)
Goodwill and intangible assets
(other than MSRs) (37.7) (38.1)
Applicable deferred tax assets 5.3 5.6
Deferred tax asset limitation (1.0) (6.0)
MSRs over specified limitations (1.6) (1.5)
Cumulative other
comprehensive income (3.0) 6.9
Other (0.2) (0.8)
Tier 1 common equity (A) $ 65.5 34.4
Total risk-weighted assets (2) (B) $1,013.6 1,101.3
Tier 1 common equity to total
risk-weighted assets (A)/(B) 6.46% 3.13
(1) Tier 1 common equity is a non-GAAP financial measure that is used by
investors, analysts and bank regulatory agencies, including the Federal
Reserve in the SCAP, to assess the capital position of financial services
companies. Tier 1 common equity includes total Wells Fargo stockholders’
equity, less preferred equity, goodwill and intangible assets (excluding MSRs),
net of related deferred taxes, adjusted for specified Tier 1 regulatory capital
limitations covering deferred taxes, MSRs, and cumulative other comprehensive
income. Management reviews Tier 1 common equity along with other measures
of capital as part of its financial analyses and has included this non-GAAP
financial information, and the corresponding reconciliation to total equity,
because of current interest in such information on the part of market participants.
(2) Under the regulatory guidelines for risk-based capital, on-balance sheet assets
and credit equivalent amounts of derivatives and off-balance sheet items are
assigned to one of several broad risk categories according to the obligor or, if
relevant, the guarantor or the nature of any collateral. The aggregate dollar
amount in each risk category is then multiplied by the risk weight associated
with that category. The resulting weighted values from each of the risk
categories are aggregated for determining total risk-weighted assets.
Our significant accounting policies (see Note 1 (Summary of
Significant Accounting Policies) to Financial Statements in
this Report) are fundamental to understanding our results of
operations and financial condition, because they require that
we use estimates and assumptions that may affect the value
of our assets or liabilities and financial results. Six of these
policies are critical because they require management to
make difficult, subjective and complex judgments about
matters that are inherently uncertain and because it is likely
that materially different amounts would be reported under
different conditions or using different assumptions. These
policies govern:
• the allowance for credit losses;
• purchased credit-impaired (PCI) loans;
• the valuation of residential mortgage servicing rights (MSRs);
• the fair valuation of financial instruments;
• pension accounting; and
• income taxes.
Management has reviewed and approved these critical
accounting policies and has discussed these policies with the
Audit and Examination Committee of the Company’s Board.
Allowance for Credit Losses
The allowance for credit losses, which consists of the
allowance for loan losses and the reserve for unfunded credit
commitments, reflects management’s judgment of probable
credit losses inherent in the portfolio and unfunded lending
commitments at the balance sheet date.
We use a disciplined process and methodology to establish
our allowance for credit each quarter. While our methodology
attributes portions of the allowance to specific portfolios as
part of our analytical process, the entire allowance for credit
losses is available to absorb credit losses in the total loan
portfolio. Additionally, while the allowance is built by portfo-
lio, it is allocated by loan type for external reporting purposes.
To determine the total allowance for loan losses, we esti-
mate the reserves needed for each component of the portfolio,
including loans analyzed individually and loans analyzed on a
pooled basis.
The allowance for loan losses consists of amounts applica-
ble to: (i) the consumer portfolio; (ii) the commercial, CRE
and lease financing portfolio (including reserve for unfunded
credit commitments); and (iii) the PCI portfolio.
Critical Accounting Policies
PRUDENTIAL JOINT VENTURE As described in the “Contractual
Obligations” section in our 2008 Form 10-K, during 2009 we
owned a controlling interest in a retail securities brokerage
joint venture, which Wachovia entered into with Prudential
Financial, Inc. (Prudential) in 2003. See also Note 1 (Summary
of Significant Accounting Policies – Accounting Standards
Adopted in 2009) to Financial Statements in this Report for
additional information. In 2009, Prudential’s noncontrolling
interest was 23% of the joint venture. On December 31, 2009,
we purchased Prudential’s noncontrolling interest for
$4.5 billion in cash. We now own 100% of the retail
securities brokerage business.