Wells Fargo 2009 Annual Report Download - page 51
Download and view the complete annual report
Please find page 51 of the 2009 Wells Fargo annual report below. You can navigate through the pages in the report by either clicking on the pages listed below, or by using the keyword search tool below to find specific information within the annual report.-
 1
1 -
2
-
3
-
4
-
5
-
6
-
7
-
8
-
9
-
10
-
11
-
12
-
13
-
14
-
15
-
16
-
17
-
18
-
19
-
20
-
21
-
22
-
23
-
24
-
25
-
26
-
27
-
28
-
29
-
30
-
31
-
32
-
33
-
34
-
35
-
36
-
37
-
38
-
39
-
40
-
 41
41 -
 42
42 -
 43
43 -
 44
44 -
 45
45 -
 46
46 -
 47
47 -
 48
48 -
 49
49 -
 50
50 -
 51
51 -
 52
52 -
 53
53 -
 54
54 -
 55
55 -
 56
56 -
 57
57 -
 58
58 -
 59
59 -
 60
60 -
 61
61 -
62
-
63
-
64
-
65
-
66
-
67
-
68
-
69
-
70
-
71
-
72
-
73
-
74
-
75
-
76
-
77
-
78
-
79
-
80
-
81
-
82
-
83
-
84
-
85
-
86
-
87
-
88
-
89
-
90
-
91
-
92
-
93
-
94
-
95
-
96
-
97
-
98
-
99
-
100
-
101
-
102
-
103
-
104
-
105
-
106
-
107
-
108
-
109
-
110
-
111
-
112
-
113
-
114
-
115
-
116
-
117
-
118
-
119
-
120
-
121
-
122
-
123
-
124
-
125
-
126
-
127
-
128
-
129
-
130
-
131
-
132
-
133
-
134
-
135
-
136
-
137
-
138
-
139
-
140
-
141
-
142
-
143
-
144
-
145
-
146
-
147
-
148
-
149
-
150
-
151
-
152
-
153
-
154
-
155
-
156
-
157
-
158
-
159
-
160
-
161
-
162
-
163
-
164
-
165
-
166
-
167
-
168
-
169
-
170
-
171
-
172
-
173
-
174
-
175
-
176
-
177
-
178
-
179
-
180
-
181
-
182
-
183
-
184
-
185
-
186
-
187
-
188
-
189
-
190
-
191
-
192
-
193
-
194
-
195
-
196
 |
 |

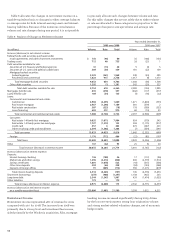
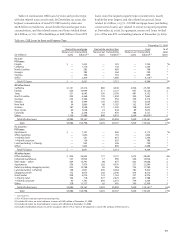
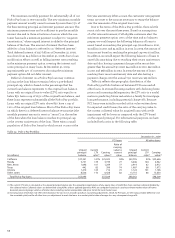
Table 12: Changes in Nonaccretable Difference for PCI Loans
Commercial,
CRE and Other
(in millions) foreign Pick-a-Pay consumer Total
Balance at December 31, 2008, with refinements $(10,410) (26,485) (4,069) (40,964)
Release of nonaccretable difference due to:
Loans resolved by payment in full (1) 330 — — 330
Loans resolved by sales to third parties (2) 86 — 85 171
Loans with improving cash flows reclassified to accretable yield (3) 138 27 276 441
Use of nonaccretable difference due to:
Losses from loan resolutions and write-downs (4) 4,853 10,218 2,086 17,157
Balance at December 31, 2009 $ (5,003) (16,240) (1,622) (22,865)
(1) Release of the nonaccretable difference for payments in full increases interest income in the period of payment. Pick-a-Pay and other consumer PCI loans do not reflect
nonaccretable difference releases due to accounting for those loans on a pooled basis.
(2) Release of the nonaccretable difference as a result of sales to third parties increases noninterest income in the period of the sale.
(3) Reclassification of nonaccretable difference for probable and significant increased cash flow estimates to the accretable yield will result in increasing income and thus the
rate of return over the remaining life of the PCI loan or pool of loans.
(4) Write-downs to net realizable value of PCI loans are charged to the nonaccretable difference when severe delinquency (normally 180 days) or other indications of severe
borrower financial stress exist that indicate there will be a loss upon final resolution of the loan.
For further detail on PCI loans, see Note 1 (Summary of
Significant Accounting Policies – Loans) and Note 6 (Loans
and Allowance for Credit Losses) to Financial Statements in
this Report.
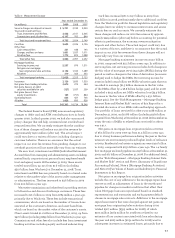
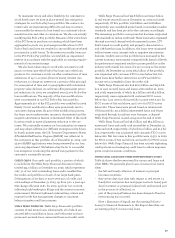
Table 13 shows contractual loan maturities for selected
loan categories and sensitivities of those loans to changes in
interest rates.
Table 13: Maturities for Selected Loan Categories
December 31,
2009 2008
After After
Within one year After Within one year After
one through five one through five
(in millions) year five years years Total year five years years Total
Selected loan maturities:
Commercial $ 44,919 91,951 21,482 158,352 59,246 109,764 33,459 202,469
Real estate mortgage 29,982 44,312 30,504 104,798 23,880 45,565 33,663 103,108
Real estate construction 18,719 10,055 933 29,707 19,270 13,942 1,464 34,676
Foreign 21,266 5,715 2,417 29,398 23,605 7,288 2,989 33,882
Total selected loans $114,886 152,033 55,336 322,255 126,001 176,559 71,575 374,135
Distribution of loans due after one year
to changes in interest rates:
Loans at fixed interest rates $ 26,373 18,921 24,766 23,628
Loans at floating/variable interest rates 125,660 36,415 151,793 47,947
Total selected loans $152,033 55,336 176,559 71,575