Wells Fargo 2009 Annual Report Download - page 193
Download and view the complete annual report
Please find page 193 of the 2009 Wells Fargo annual report below. You can navigate through the pages in the report by either clicking on the pages listed below, or by using the keyword search tool below to find specific information within the annual report.-
 1
1 -
2
-
3
-
4
-
5
-
6
-
7
-
8
-
9
-
10
-
11
-
12
-
13
-
14
-
15
-
16
-
17
-
18
-
19
-
20
-
21
-
22
-
23
-
24
-
25
-
26
-
27
-
28
-
29
-
30
-
31
-
32
-
33
-
34
-
35
-
36
-
37
-
38
-
39
-
40
-
41
-
42
-
43
-
44
-
45
-
46
-
47
-
48
-
49
-
50
-
51
-
52
-
53
-
54
-
55
-
56
-
57
-
58
-
59
-
60
-
61
-
62
-
63
-
64
-
65
-
66
-
67
-
68
-
69
-
70
-
71
-
72
-
73
-
74
-
75
-
76
-
77
-
78
-
79
-
80
-
81
-
82
-
83
-
84
-
85
-
86
-
87
-
88
-
89
-
90
-
91
-
92
-
93
-
94
-
95
-
96
-
97
-
98
-
99
-
100
-
101
-
102
-
103
-
104
-
105
-
106
-
107
-
108
-
109
-
110
-
111
-
112
-
113
-
114
-
115
-
116
-
117
-
118
-
119
-
120
-
121
-
122
-
123
-
124
-
125
-
126
-
127
-
128
-
129
-
130
-
131
-
132
-
133
-
134
-
135
-
136
-
137
-
138
-
139
-
140
-
141
-
142
-
143
-
144
-
145
-
146
-
147
-
148
-
149
-
150
-
151
-
152
-
153
-
154
-
155
-
156
-
157
-
158
-
159
-
160
-
161
-
162
-
163
-
164
-
165
-
166
-
167
-
168
-
169
-
170
-
171
-
172
-
173
-
174
-
175
-
176
-
177
-
178
-
179
-
180
-
181
-
182
-
 183
183 -
 184
184 -
 185
185 -
 186
186 -
 187
187 -
 188
188 -
 189
189 -
 190
190 -
 191
191 -
 192
192 -
 193
193 -
 194
194 -
 195
195 -
 196
196
 |
 |
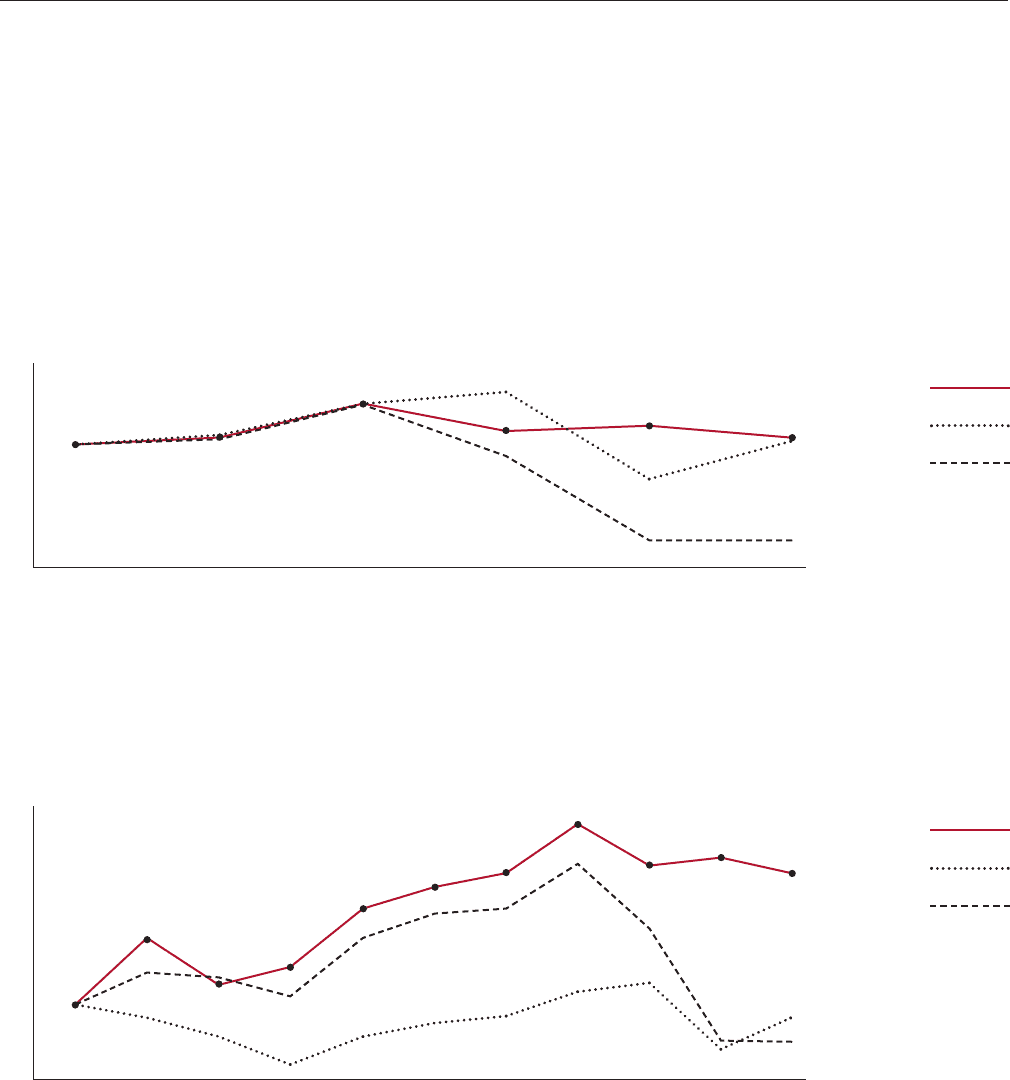
Stock Performance
These graphs compare the cumulative total stockholder
return and total compound annual growth rate (CAGR) for
our common stock (NYSE: WFC) for the five- and ten-year
periods ended December 31, 2009, with the cumulative total
stockholder returns for the same periods for the Keefe,
Bruyette and Woods (KBW) Total Return Bank Index (BKX)
(KBW Bank Index ) and the S&P 500 Index. Prior to 2009,
we included the KBW 50 Total Return Index for purposes
of computing the comparisons shown in these graphs.
During 2009, the KBW Bank Index replaced the KBW 50
Total Return Index, which has been discontinued.
The cumulative total stockholder returns (including
reinvested dividends) in the graphs assume the investment
of $100 in Wells Fargo’s common stock, the KBW Bank
Index and the S&P 500 Index.
$140
$120
$100
$ 80
$ 60
$40
2004
$100
100
100
2005
$104
105
103
2006
$122
121
121
2007
$107
128
94
2008
$110
81
49
2009
$104
102
49
1999
$100
100
100
2000
$141
91
120
2001
$112
80
117
2002
$124
62
105
2003
$160
80
141
2004
$174
89
156
2005
$182
93
160
2006
$213
108
188
2007
$187
114
147
2008
$191
72
77
2009
$182
91
76
5-year
CAGR
1% Wells Fargo
0% S&P 500
-13% KBW Bank Index
Five Year Performance Graph
10-year
CAGR
6% Wells Fargo
-1% S&P 500
-3% KBW Bank Index
Wells Fargo
(WFC)
S&P 500
KBW Bank
Index
$220
$200
$180
$160
$140
$120
$100
$80
$60
Ten Year Performance Graph
Wells Fargo
(WFC)
S&P 500
KBW Bank
Index