Wells Fargo 2009 Annual Report Download - page 159
Download and view the complete annual report
Please find page 159 of the 2009 Wells Fargo annual report below. You can navigate through the pages in the report by either clicking on the pages listed below, or by using the keyword search tool below to find specific information within the annual report.-
 1
1 -
2
-
3
-
4
-
5
-
6
-
7
-
8
-
9
-
10
-
11
-
12
-
13
-
14
-
15
-
16
-
17
-
18
-
19
-
20
-
21
-
22
-
23
-
24
-
25
-
26
-
27
-
28
-
29
-
30
-
31
-
32
-
33
-
34
-
35
-
36
-
37
-
38
-
39
-
40
-
41
-
42
-
43
-
44
-
45
-
46
-
47
-
48
-
49
-
50
-
51
-
52
-
53
-
54
-
55
-
56
-
57
-
58
-
59
-
60
-
61
-
62
-
63
-
64
-
65
-
66
-
67
-
68
-
69
-
70
-
71
-
72
-
73
-
74
-
75
-
76
-
77
-
78
-
79
-
80
-
81
-
82
-
83
-
84
-
85
-
86
-
87
-
88
-
89
-
90
-
91
-
92
-
93
-
94
-
95
-
96
-
97
-
98
-
99
-
100
-
101
-
102
-
103
-
104
-
105
-
106
-
107
-
108
-
109
-
110
-
111
-
112
-
113
-
114
-
115
-
116
-
117
-
118
-
119
-
120
-
121
-
122
-
123
-
124
-
125
-
126
-
127
-
128
-
129
-
130
-
131
-
132
-
133
-
134
-
135
-
136
-
137
-
138
-
139
-
140
-
141
-
142
-
143
-
144
-
145
-
146
-
147
-
148
-
 149
149 -
 150
150 -
 151
151 -
 152
152 -
 153
153 -
 154
154 -
 155
155 -
 156
156 -
 157
157 -
 158
158 -
 159
159 -
 160
160 -
 161
161 -
 162
162 -
 163
163 -
 164
164 -
 165
165 -
 166
166 -
 167
167 -
 168
168 -
 169
169 -
170
-
171
-
172
-
173
-
174
-
175
-
176
-
177
-
178
-
179
-
180
-
181
-
182
-
183
-
184
-
185
-
186
-
187
-
188
-
189
-
190
-
191
-
192
-
193
-
194
-
195
-
196
 |
 |

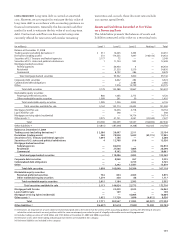
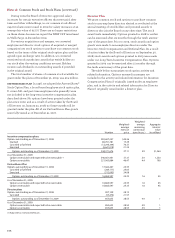
Net unrealized
Purchases, gains (losses)
Total net gains sales, Net included in net
(losses) included in issuances transfers income related
Balance, Other and into and/ Balance, to assets and
beginning Net comprehensive settlements, or out of end liabilities held
(in millions) of year income income net Level 3(1) of year at period end(2)
Year ended December 31, 2009
Trading assets (excluding derivatives) $ 3,495 202 2 (1,749) 361 2,311 276(3)
Securities available for sale:
Securities of U.S. states and
political subdivisions 903 23 — 25 (133) 818 (8)
Mortgage-backed securities:
Federal agencies 4 — — — (4) — —
Residential 3,510 (74) 1,092 (759) (2,685) 1,084 (227)
Commercial 286 (220) 894 41 798 1,799 (112)
Total mortgage-backed securities 3,800 (294) 1,986 (718) (1,891) 2,883 (339)
Corporate debt securities 282 3 61 (7) 28 367 —
Collateralized debt obligations 2,083 125 577 623 317 3,725 (84)
Other 12,799 136 1,368 584 (2,300) 12,587 (94)
Total debt securities 19,867 (7) 3,992 507 (3,979) 20,380 (525)
Marketable equity securities:
Perpetual preferred securities 2,775 104 144 (723) 5 2,305 (1)
Other marketable equity securities 50 — (2) 63 (23) 88 —
Total marketable equity securities 2,825 104 142 (660) (18) 2,393 (1)
Total securities available for sale $22,692 97 4,134 (153) (3,997) 22,773 (526)
Mortgages held for sale $ 4,718 (96) — (921) (178) 3,523 (109)(4)
Mortgage servicing rights (residential) 14,714 (4,970) — 6,260 — 16,004 (1,534)(4)
Net derivative assets and liabilities 37 1,439 — (2,291) (17) (832) (799)(6)
Other assets (excluding derivatives) 1,231 10 — 132 — 1,373 12
Other liabilities (excluding derivatives) (638) (630) — 168 (10) (1,110) (606)
(1) The amounts presented as transfers into and out of Level 3 represent fair value as of the beginning of the quarter in which each transfer occurred.
(2) Represents only net gains (losses) that are due to changes in economic conditions and management’s estimates of fair value and excludes changes due to the collection/
realization of cash flows over time.
(3) Included in other noninterest income in the income statement.
(4) Included in mortgage banking in the income statement.
(5) Represents total unrealized losses of $3.3 billion and $571 million, net of losses of $8 million and gains of $23 million related to sales, in 2008 and 2007, respectively.
(6) Included in mortgage banking, trading activities and other noninterest income in the income statement.
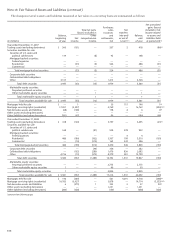
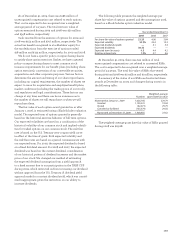
(continued from previous page)
table below. Fair value measurements obtained from indepen-
dent brokers or independent third party pricing services that
we have adjusted to determine the fair value recorded in our
financial statements are not included in the table below.
For certain assets and liabilities, we obtain fair value mea-
surements from independent brokers or independent third
party pricing services and record the unadjusted fair value in
our financial statements. The detail by level is shown in the
Fair value measurements from:
Independent brokers Third party pricing services
(in millions) Level 1 Level 2 Level 3 Level 1 Level 2 Level 3
December 31, 2008
Trading assets (excluding derivatives) $ 190 3,272 12 917 1,944 110
Derivatives (trading and other assets) 3,419 106 106 605 4,635 —
Securities available for sale 181 8,916 1,681 3,944 109,170 8
Loans held for sale — 1 — — 353 —
Other liabilities 1,105 175 128 2,208 5,171 1
December 31, 2009
Trading assets (excluding derivatives) $ — 4,208 — 30 1,712 81
Derivatives (trading and other assets) — 8 42 — 2,926 9
Securities available for sale 85 1,870 548 1,467 120,688 1,864
Loans held for sale — — — — 2 —
Derivatives (liabilities) — — 70 — 2,949 4
Other liabilities — — — 10 3,916 26