Wells Fargo 2009 Annual Report Download - page 175
Download and view the complete annual report
Please find page 175 of the 2009 Wells Fargo annual report below. You can navigate through the pages in the report by either clicking on the pages listed below, or by using the keyword search tool below to find specific information within the annual report.-
 1
1 -
2
-
3
-
4
-
5
-
6
-
7
-
8
-
9
-
10
-
11
-
12
-
13
-
14
-
15
-
16
-
17
-
18
-
19
-
20
-
21
-
22
-
23
-
24
-
25
-
26
-
27
-
28
-
29
-
30
-
31
-
32
-
33
-
34
-
35
-
36
-
37
-
38
-
39
-
40
-
41
-
42
-
43
-
44
-
45
-
46
-
47
-
48
-
49
-
50
-
51
-
52
-
53
-
54
-
55
-
56
-
57
-
58
-
59
-
60
-
61
-
62
-
63
-
64
-
65
-
66
-
67
-
68
-
69
-
70
-
71
-
72
-
73
-
74
-
75
-
76
-
77
-
78
-
79
-
80
-
81
-
82
-
83
-
84
-
85
-
86
-
87
-
88
-
89
-
90
-
91
-
92
-
93
-
94
-
95
-
96
-
97
-
98
-
99
-
100
-
101
-
102
-
103
-
104
-
105
-
106
-
107
-
108
-
109
-
110
-
111
-
112
-
113
-
114
-
115
-
116
-
117
-
118
-
119
-
120
-
121
-
122
-
123
-
124
-
125
-
126
-
127
-
128
-
129
-
130
-
131
-
132
-
133
-
134
-
135
-
136
-
137
-
138
-
139
-
140
-
141
-
142
-
143
-
144
-
145
-
146
-
147
-
148
-
149
-
150
-
151
-
152
-
153
-
154
-
155
-
156
-
157
-
158
-
159
-
160
-
161
-
162
-
163
-
164
-
 165
165 -
 166
166 -
 167
167 -
 168
168 -
 169
169 -
 170
170 -
 171
171 -
 172
172 -
 173
173 -
 174
174 -
 175
175 -
 176
176 -
 177
177 -
 178
178 -
 179
179 -
 180
180 -
 181
181 -
 182
182 -
 183
183 -
 184
184 -
 185
185 -
186
-
187
-
188
-
189
-
190
-
191
-
192
-
193
-
194
-
195
-
196
 |
 |

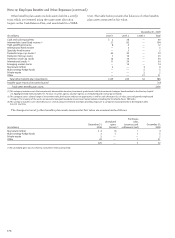
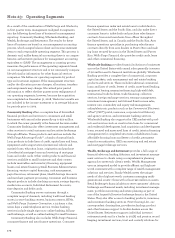
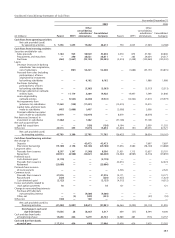
Year ended December 31,
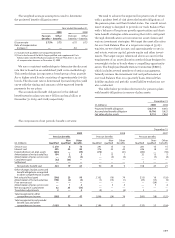
(in millions) 2009 2008 2007
Outside professional services $1,982 847 899
Contract services 1,088 407 448
Foreclosed assets 1,071 414 256
Outside data processing 1,027 480 482
Postage, stationery and supplies 933 556 565
Insurance 845 725 416
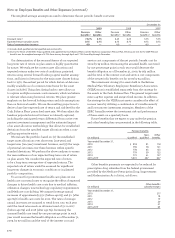
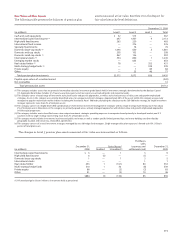
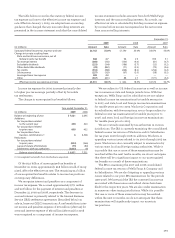
VALUATION METHODOLOGIES Following is a description
of the valuation methodologies used for assets measured
at fair value.
Cash and Cash Equivalents – includes investments in U.S.
Treasury bills, valued at quoted market prices and collective
investment funds. Investments in collective investment funds
are valued at fair value based upon the quoted market values
of the underlying net assets. The unit price is quoted on a
private market that is not active; however, the unit price is
based on underlying investments traded on an active market.
Intermediate (Core), High-Yield, International and
Specialty Fixed Income – includes bonds and notes traded
on a national securities exchange valued at the last reported
sale price on the last business day of the year. Also includes
investments traded on the OTC market and listed securities
for which no sale was reported on that date; both are valued
at the average of the last reported bid and ask prices. Also
includes investments in collective investment funds
described above.
Domestic, International and Emerging Market Stocks –
investments in common stock are valued at quoted market
values. Investments in registered investment companies are
valued at the NAV of shares held at year end. Also includes
investments in collective investment funds described above.
Real Estate and Timber – the fair value of real estate and
timber is estimated based primarily on appraisals prepared
by third-party appraisers. Market values are estimates
and the actual market price of the real estate can only be
determined by negotiation between independent third
parties in a sales transaction.
Multi-Strategy Hedge Funds and Private Equity – the fair
values of hedge funds are valued based on the proportionate
share of the underlying net assets of the investment funds
that comprise the fund, based on valuations supplied by the
underlying investment funds. Investments in private equity
funds are valued at the NAV provided by the fund sponsor.
Market values are estimates and the actual market price
of the investments can only be determined by negotiation
between independent third parties in a sales transaction.
Other – the fair values of miscellaneous investments are val-
ued at the NAV provided by the fund sponsor. Market values
are estimates and the actual market price of the investments
can only be determined by negotiation between independent
third parties in a sales transaction. Also includes insurance
contracts that are generally stated at cash surrender value.
The methods described above may produce a fair value
calculation that may not be indicative of net realizable
value or reflective of future fair values. While we believe our
valuation methods are appropriate and consistent with other
market participants, the use of different methodologies or
assumptions to determine the fair value of certain financial
instruments could result in a different fair value measurement
at the reporting date.
Other Expenses
Expenses exceeding 1% of total interest income and
noninterest income in any of the years presented that are
not otherwise shown separately in the financial statements
or Notes to Financial Statements were: