Wells Fargo 2009 Annual Report Download - page 190
Download and view the complete annual report
Please find page 190 of the 2009 Wells Fargo annual report below. You can navigate through the pages in the report by either clicking on the pages listed below, or by using the keyword search tool below to find specific information within the annual report.-
 1
1 -
2
-
3
-
4
-
5
-
6
-
7
-
8
-
9
-
10
-
11
-
12
-
13
-
14
-
15
-
16
-
17
-
18
-
19
-
20
-
21
-
22
-
23
-
24
-
25
-
26
-
27
-
28
-
29
-
30
-
31
-
32
-
33
-
34
-
35
-
36
-
37
-
38
-
39
-
40
-
41
-
42
-
43
-
44
-
45
-
46
-
47
-
48
-
49
-
50
-
51
-
52
-
53
-
54
-
55
-
56
-
57
-
58
-
59
-
60
-
61
-
62
-
63
-
64
-
65
-
66
-
67
-
68
-
69
-
70
-
71
-
72
-
73
-
74
-
75
-
76
-
77
-
78
-
79
-
80
-
81
-
82
-
83
-
84
-
85
-
86
-
87
-
88
-
89
-
90
-
91
-
92
-
93
-
94
-
95
-
96
-
97
-
98
-
99
-
100
-
101
-
102
-
103
-
104
-
105
-
106
-
107
-
108
-
109
-
110
-
111
-
112
-
113
-
114
-
115
-
116
-
117
-
118
-
119
-
120
-
121
-
122
-
123
-
124
-
125
-
126
-
127
-
128
-
129
-
130
-
131
-
132
-
133
-
134
-
135
-
136
-
137
-
138
-
139
-
140
-
141
-
142
-
143
-
144
-
145
-
146
-
147
-
148
-
149
-
150
-
151
-
152
-
153
-
154
-
155
-
156
-
157
-
158
-
159
-
160
-
161
-
162
-
163
-
164
-
165
-
166
-
167
-
168
-
169
-
170
-
171
-
172
-
173
-
174
-
175
-
176
-
177
-
178
-
179
-
 180
180 -
 181
181 -
 182
182 -
 183
183 -
 184
184 -
 185
185 -
 186
186 -
 187
187 -
 188
188 -
 189
189 -
 190
190 -
 191
191 -
 192
192 -
 193
193 -
 194
194 -
 195
195 -
 196
196
 |
 |

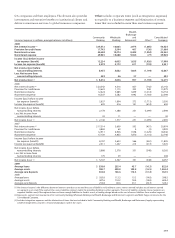
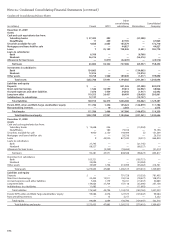
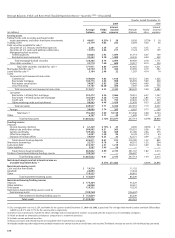
Average Balances, Yields and Rates Paid (Taxable-Equivalent Basis) – Quarterly (1)(2) – (Unaudited)
Quarter ended December 31,
2009 2008
Interest Interest
Average Yields/ income/ Average Yields/ income/
(in millions) balance rates expense balance rates expense
Earning assets
Federal funds sold, securities purchased under
resale agreements and other short-term investments $ 46,031 0.33% $ 39 9,938 0.73% $ 18
Trading assets 23,179 4.05 235 5,004 4.50 56
Debt securities available for sale (3):
Securities of U.S. Treasury and federal agencies 2,381 3.54 21 1,165 3.75 11
Securities of U.S. states and political subdivisions 13,574 6.48 217 7,124 6.73 139
Mortgage-backed securities:
Federal agencies 85,063 5.43 1,099 51,714 6.07 769
Residential and commercial 43,243 9.20 1,000 18,245 6.40 402
Total mortgage-backed securities 128,306 6.74 2,099 69,959 6.18 1,171
Other debt securities (4) 33,710 7.60 600 14,217 8.10 330
Total debt securities available for sale (4) 177,971 6.84 2,937 92,465 6.50 1,651
Mortgages held for sale (5) 34,750 5.13 446 23,390 6.19 362
Loans held for sale (5) 5,104 2.48 32 1,287 4.14 14
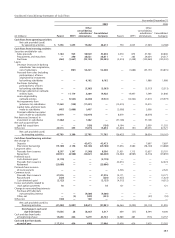
Loans:
Commercial and commercial real estate:
Commercial 164,050 4.65 1,918 107,325 5.66 1,525
Real estate mortgage 104,773 3.44 908 45,555 5.49 628
Real estate construction 30,887 3.03 236 19,943 4.49 225
Lease financing 14,107 10.20 360 7,397 5.58 103
Total commercial and commercial real estate 313,817 4.33 3,422 180,220 5.48 2,481
Consumer:
Real estate 1-4 family first mortgage 232,273 5.26 3,066 78,251 6.37 1,247
Real estate 1-4 family junior lien mortgage 103,584 4.58 1,195 75,838 5.85 1,114
Credit card 23,717 12.18 723 20,626 12.21 629
Other revolving credit and installment 88,963 6.46 1,450 52,638 8.35 1,107
Total consumer 448,537 5.71 6,434 227,353 7.19 4,097
Foreign 30,086 3.74 283 6,367 9.73 156
Total loans (5) 792,440 5.09 10,139 413,940 6.48 6,734
Other 6,147 3.13 49 1,690 5.37 23
Total earning assets $1,085,622 5.12% $13,877 547,714 6.34% $8,858
Funding sources
Deposits:
Interest-bearing checking $ 61,229 0.15% $ 23 6,396 0.65% $ 11
Market rate and other savings 389,905 0.31 303 178,301 0.96 430
Savings certificates 109,306 1.66 458 41,189 2.66 275
Other time deposits 16,501 2.28 94 8,128 2.74 54
Deposits in foreign offices 59,870 0.23 35 42,771 0.69 75
Total interest-bearing deposits 636,811 0.57 913 276,785 1.22 845
Short-term borrowings 32,757 0.18 14 60,210 1.35 204
Long-term debt 210,707 2.31 1,218 104,112 3.69 964
Other liabilities 5,587 3.49 50 ———
Total interest-bearing liabilities 885,862 0.99 2,195 441,107 1.82 2,013
Portion of noninterest-bearing funding sources 199,760 — —106,607 — —
Total funding sources $1,085,622 0.81 2,195 547,714 1.44 2,013
Net interest margin and net interest income on
a taxable-equivalent basis (6) 4.31% $11,682 4.90% $6,845
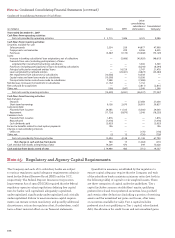
Noninterest-earning assets
Cash and due from banks $ 19,216 11,155
Goodwill 24,093 13,544
Other 110,525 60,810
Total noninterest-earning assets $ 153,834 85,509
Noninterest-bearing funding sources
Deposits $ 179,204 91,229
Other liabilities 45,058 30,651
Total equity 129,332 70,236
Noninterest-bearing funding sources used to
fund earning assets (199,760) (106,607)
Net noninterest-bearing funding sources $ 153,834 85,509
Total assets $1,239,456 633,223
(1) Our average prime rate was 3.25% and 4.06% for the quarters ended December 31, 2009 and 2008, respectively. The average three-month London Interbank Offered Rate
(LIBOR) was 0.27% and 2.77% for the same quarters, respectively.
(2) Interest rates and amounts include the effects of hedge and risk management activities associated with the respective asset and liability categories.
(3) Yields are based on amortized cost balances computed on a settlement date basis.
(4) Includes certain preferred securities.
(5) Nonaccrual loans and related income are included in their respective loan categories.
(6) Includes taxable-equivalent adjustments primarily related to tax-exempt income on certain loans and securities. The federal statutory tax rate was 35% for the periods presented.