Wells Fargo 2009 Annual Report Download - page 57
Download and view the complete annual report
Please find page 57 of the 2009 Wells Fargo annual report below. You can navigate through the pages in the report by either clicking on the pages listed below, or by using the keyword search tool below to find specific information within the annual report.-
 1
1 -
2
-
3
-
4
-
5
-
6
-
7
-
8
-
9
-
10
-
11
-
12
-
13
-
14
-
15
-
16
-
17
-
18
-
19
-
20
-
21
-
22
-
23
-
24
-
25
-
26
-
27
-
28
-
29
-
30
-
31
-
32
-
33
-
34
-
35
-
36
-
37
-
38
-
39
-
40
-
41
-
42
-
43
-
44
-
45
-
46
-
 47
47 -
 48
48 -
 49
49 -
 50
50 -
 51
51 -
 52
52 -
 53
53 -
 54
54 -
 55
55 -
 56
56 -
 57
57 -
 58
58 -
 59
59 -
 60
60 -
 61
61 -
 62
62 -
 63
63 -
 64
64 -
 65
65 -
 66
66 -
 67
67 -
68
-
69
-
70
-
71
-
72
-
73
-
74
-
75
-
76
-
77
-
78
-
79
-
80
-
81
-
82
-
83
-
84
-
85
-
86
-
87
-
88
-
89
-
90
-
91
-
92
-
93
-
94
-
95
-
96
-
97
-
98
-
99
-
100
-
101
-
102
-
103
-
104
-
105
-
106
-
107
-
108
-
109
-
110
-
111
-
112
-
113
-
114
-
115
-
116
-
117
-
118
-
119
-
120
-
121
-
122
-
123
-
124
-
125
-
126
-
127
-
128
-
129
-
130
-
131
-
132
-
133
-
134
-
135
-
136
-
137
-
138
-
139
-
140
-
141
-
142
-
143
-
144
-
145
-
146
-
147
-
148
-
149
-
150
-
151
-
152
-
153
-
154
-
155
-
156
-
157
-
158
-
159
-
160
-
161
-
162
-
163
-
164
-
165
-
166
-
167
-
168
-
169
-
170
-
171
-
172
-
173
-
174
-
175
-
176
-
177
-
178
-
179
-
180
-
181
-
182
-
183
-
184
-
185
-
186
-
187
-
188
-
189
-
190
-
191
-
192
-
193
-
194
-
195
-
196
 |
 |

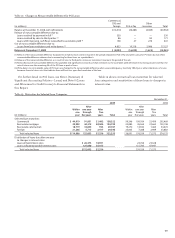
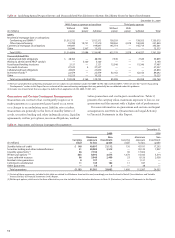
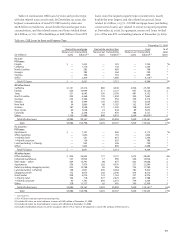
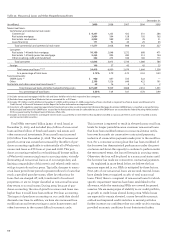
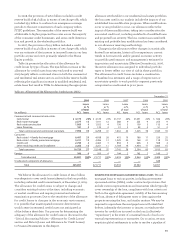
Table 20 summarizes CRE loans by state and product type
with the related nonaccrual totals. At December 31, 2009, the
highest concentration of non-PCI CRE loans by state was
$27.8 billion in California, about double the next largest state
concentration, and the related nonaccrual loans totaled about
$2.0 billion, or 7.2%. Office buildings, at $28.7 billion of non-PCI
loans, were the largest property type concentration, nearly
double the next largest, and the related nonaccrual loans
totaled $1.1 billion, or 3.7%. Of CRE mortgage loans (excluding
construction loans), 43% related to owner-occupied properties
at December 31, 2009. In aggregate, nonaccrual loans totaled
5.6% of the non-PCI outstanding balance at December 31, 2009.
Table 20: CRE Loans by State and Property Type
December 31, 2009
Real estate mortgage Real estate construction Total % of
Nonaccrual Outstanding Nonaccrual Outstanding Nonaccrual Outstanding total
(in millions) loans balance (1) loans balance(1) loans balance(1) loans
By state:
PCI loans:
Florida $ — 1,022 — 722 — 1,744 *%
California — 1,116 — 150 — 1,266 *
North Carolina — 283 — 485 — 768 *
Georgia — 385 — 364 — 749 *
Virginia — 396 — 303 — 699 *
Other — 2,429 — 1,689 — 4,118(2) 1
Total PCI loans $ — 5,631 — 3,713 — 9,344 1%
All other loans:
California $1,141 23,214 865 4,549 2,006 27,763 4%
Florida 626 10,999 311 2,127 937 13,126 2
Texas 231 6,643 250 2,509 481 9,152 1
North Carolina 205 5,468 135 1,594 340 7,062 1
Georgia 225 4,364 109 952 334 5,316 1
Virginia 65 3,499 105 1,555 170 5,054 1
New York 54 3,860 48 1,187 102 5,047 1
Arizona 187 3,958 171 1,045 358 5,003 1
New Jersey 66 3,028 23 644 89 3,672 *
Colorado 78 2,248 110 879 188 3,127 *
Other 1,106 31,886 898 8,953 2,004 40,839(3) 5
Total all other loans $3,984 99,167 3,025 25,994 7,009 125,161 16%
Total $3,984 104,798 3,025 29,707 7,009 134,505 17%
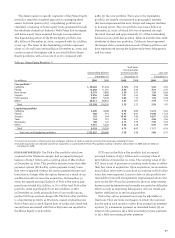
By property:
PCI loans:
Apartments $ — 1,141 — 969 — 2,110 *%
Office buildings — 1,650 — 192 — 1,842 *
1-4 family land — 531 — 815 — 1,346 *
1-4 family structure — 154 — 635 — 789 *
Land (excluding 1-4 family) — 553 — 206 — 759 *
Other — 1,602 — 896 — 2,498 *
Total PCI loans $ — 5,631 — 3,713 — 9,344 1%
All other loans:
Office buildings $ 904 25,542 171 3,151 1,075 28,693 4%
Industrial/warehouse 527 13,925 17 999 544 14,924 2
Real estate – other 564 13,791 88 877 652 14,668 2
Apartments 259 7,670 262 4,570 521 12,240 2
Retail (excluding shopping center) 620 10,788 85 996 705 11,784 2
Land (excluding 1-4 family) 148 2,941 639 6,264 787 9,205 1
Shopping center 172 6,070 242 2,240 414 8,310 1
Hotel/motel 208 5,214 123 1,162 331 6,376 1
1-4 family land 164 718 677 2,670 841 3,388 *
1-4 family structure 90 1,191 659 2,073 749 3,264 *
Other 328 11,317 62 992 390 12,309 2
Total all other loans $3,984 99,167 3,025 25,994 7,009 125,161(4) 16%
Total $3,984 104,798 3,025 29,707 7,009 134,505 17%
* Less than 1%.
(1) For PCI loans amounts represent carrying value.
(2) Includes 38 states; no state had loans in excess of $605 million at December 31, 2009.
(3) Includes 40 states; no state had loans in excess of $3.0 billion at December 31, 2009.
(4) Includes $46.6 billion of loans to owner-occupants where 51% or more of the property is used in the conduct of their business.