Wells Fargo 2009 Annual Report Download - page 121
Download and view the complete annual report
Please find page 121 of the 2009 Wells Fargo annual report below. You can navigate through the pages in the report by either clicking on the pages listed below, or by using the keyword search tool below to find specific information within the annual report.-
 1
1 -
2
-
3
-
4
-
5
-
6
-
7
-
8
-
9
-
10
-
11
-
12
-
13
-
14
-
15
-
16
-
17
-
18
-
19
-
20
-
21
-
22
-
23
-
24
-
25
-
26
-
27
-
28
-
29
-
30
-
31
-
32
-
33
-
34
-
35
-
36
-
37
-
38
-
39
-
40
-
41
-
42
-
43
-
44
-
45
-
46
-
47
-
48
-
49
-
50
-
51
-
52
-
53
-
54
-
55
-
56
-
57
-
58
-
59
-
60
-
61
-
62
-
63
-
64
-
65
-
66
-
67
-
68
-
69
-
70
-
71
-
72
-
73
-
74
-
75
-
76
-
77
-
78
-
79
-
80
-
81
-
82
-
83
-
84
-
85
-
86
-
87
-
88
-
89
-
90
-
91
-
92
-
93
-
94
-
95
-
96
-
97
-
98
-
99
-
100
-
101
-
102
-
103
-
104
-
105
-
106
-
107
-
108
-
109
-
110
-
 111
111 -
 112
112 -
 113
113 -
 114
114 -
 115
115 -
 116
116 -
 117
117 -
 118
118 -
 119
119 -
 120
120 -
 121
121 -
 122
122 -
 123
123 -
 124
124 -
 125
125 -
 126
126 -
 127
127 -
 128
128 -
 129
129 -
 130
130 -
 131
131 -
132
-
133
-
134
-
135
-
136
-
137
-
138
-
139
-
140
-
141
-
142
-
143
-
144
-
145
-
146
-
147
-
148
-
149
-
150
-
151
-
152
-
153
-
154
-
155
-
156
-
157
-
158
-
159
-
160
-
161
-
162
-
163
-
164
-
165
-
166
-
167
-
168
-
169
-
170
-
171
-
172
-
173
-
174
-
175
-
176
-
177
-
178
-
179
-
180
-
181
-
182
-
183
-
184
-
185
-
186
-
187
-
188
-
189
-
190
-
191
-
192
-
193
-
194
-
195
-
196
 |
 |

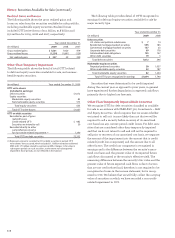
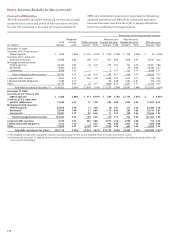
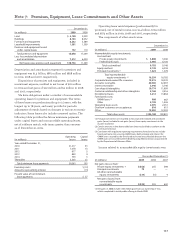
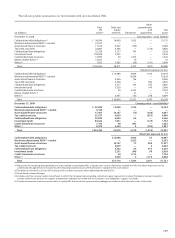
The following table presents the major categories of loans
outstanding including those subject to accounting guidance
for PCI loans. Certain loans acquired in the Wachovia acquisi-
tion are accounted for as PCI loans and are included below,
net of any remaining purchase accounting adjustments.
Note 6: Loans and Allowance for Credit Losses
December 31,
2009 2008(1) 2007 2006 2005
All All
PCI other PCI other
(in millions) loans loans Total loans loans Total
Commercial and
commercial real estate:
Commercial $ 1,911 156,441 158,352 4,580 197,889 202,469 90,468 70,404 61,552
Real estate mortgage 5,631 99,167 104,798 7,762 95,346 103,108 36,747 30,112 28,545
Real estate construction 3,713 25,994 29,707 4,503 30,173 34,676 18,854 15,935 13,406
Lease financing — 14,210 14,210 — 15,829 15,829 6,772 5,614 5,400
Total commercial and
commercial real estate 11,255 295,812 307,067 16,845 339,237 356,082 152,841 122,065 108,903
Consumer:
Real estate 1-4 family
first mortgage 38,386 191,150 229,536 39,214 208,680 247,894 71,415 53,228 77,768
Real estate 1-4 family
junior lien mortgage 331 103,377 103,708 728 109,436 110,164 75,565 68,926 59,143
Credit card — 24,003 24,003 — 23,555 23,555 18,762 14,697 12,009
Other revolving credit
and installment — 89,058 89,058 151 93,102 93,253 56,171 53,534 47,462
Total consumer 38,717 407,588 446,305 40,093 434,773 474,866 221,913 190,385 196,382
Foreign 1,733 27,665 29,398 1,859 32,023 33,882 7,441 6,666 5,552
Total loans $51,705 731,065 782,770 58,797 806,033 864,830 382,195 319,116 310,837
(1) In 2009, we refined certain of our preliminary purchase accounting adjustments based on additional information as of December 31, 2008. These refinements resulted in
increasing the PCI loans carrying value at December 31, 2008, to $59.2 billion. The table above has not been updated as of December 31, 2008, to reflect these refinements.
We pledge loans to secure borrowings from the FHLB and
the Federal Reserve Bank as part of our liquidity management
strategy. Loans pledged where the secured party does not
have the right to sell or repledge totaled $312.6 billion and
$337.5 billion at December 31, 2009 and 2008, respectively.
We did not have any pledged loans where the secured party
has the right to sell or repledge at December 31, 2009 or 2008.
Loan concentrations may exist when there are amounts
loaned to borrowers engaged in similar activities or similar
types of loans extended to a diverse group of borrowers that
would cause them to be similarly impacted by economic or
other conditions. At December 31, 2009 and 2008, we did not
have concentrations representing 10% or more of our total
loan portfolio in commercial loans and lease financing by
industry or CRE loans (real estate mortgage and real estate
construction) by state or property type. Our real estate 1-4
family mortgage loans to borrowers in the state of California
represented approximately 14% of total loans at both
December 31, 2009 and 2008. Of this amount, 3% of total
loans were PCI loans at December 31, 2009. These loans are
generally diversified among the larger metropolitan areas
in California, with no single area consisting of more than 3%
of total loans. Changes in real estate values and underlying
economic or market conditions for these areas are monitored
continuously within our credit risk management process.
Beginning in 2007, the residential real estate markets experi-
enced significant declines in property values, and several
markets in California, specifically the Central Valley and
several Southern California metropolitan statistical areas,
experienced more severe value adjustments.
Some of our real estate 1-4 family mortgage loans, including
first mortgage and home equity products, include an interest-
only feature as part of the loan terms. At December 31, 2009,
these loans were approximately 15% of total loans, compared
with 11% at December 31, 2008. Most of these loans are
considered to be prime or near prime.
For certain extensions of credit, we may require collateral,
based on our assessment of a customer’s credit risk. We hold
various types of collateral, including accounts receivable, inven-
tory, land, buildings, equipment, autos, financial instruments,
income-producing commercial properties and residential real
estate. Collateral requirements for each customer may vary
according to the specific credit underwriting, terms and struc-
ture of loans funded immediately or under a commitment to
fund at a later date.
Outstanding balances of all other loans are presented net
of unearned income, net deferred loan fees, and unamortized
discount and premium totaling $14.6 billion at December 31,
2009, and $16.9 billion, at December 31, 2008.