Wells Fargo 2009 Annual Report Download - page 113
Download and view the complete annual report
Please find page 113 of the 2009 Wells Fargo annual report below. You can navigate through the pages in the report by either clicking on the pages listed below, or by using the keyword search tool below to find specific information within the annual report.-
 1
1 -
2
-
3
-
4
-
5
-
6
-
7
-
8
-
9
-
10
-
11
-
12
-
13
-
14
-
15
-
16
-
17
-
18
-
19
-
20
-
21
-
22
-
23
-
24
-
25
-
26
-
27
-
28
-
29
-
30
-
31
-
32
-
33
-
34
-
35
-
36
-
37
-
38
-
39
-
40
-
41
-
42
-
43
-
44
-
45
-
46
-
47
-
48
-
49
-
50
-
51
-
52
-
53
-
54
-
55
-
56
-
57
-
58
-
59
-
60
-
61
-
62
-
63
-
64
-
65
-
66
-
67
-
68
-
69
-
70
-
71
-
72
-
73
-
74
-
75
-
76
-
77
-
78
-
79
-
80
-
81
-
82
-
83
-
84
-
85
-
86
-
87
-
88
-
89
-
90
-
91
-
92
-
93
-
94
-
95
-
96
-
97
-
98
-
99
-
100
-
101
-
102
-
 103
103 -
 104
104 -
 105
105 -
 106
106 -
 107
107 -
 108
108 -
 109
109 -
 110
110 -
 111
111 -
 112
112 -
 113
113 -
 114
114 -
 115
115 -
 116
116 -
 117
117 -
 118
118 -
 119
119 -
 120
120 -
 121
121 -
 122
122 -
 123
123 -
124
-
125
-
126
-
127
-
128
-
129
-
130
-
131
-
132
-
133
-
134
-
135
-
136
-
137
-
138
-
139
-
140
-
141
-
142
-
143
-
144
-
145
-
146
-
147
-
148
-
149
-
150
-
151
-
152
-
153
-
154
-
155
-
156
-
157
-
158
-
159
-
160
-
161
-
162
-
163
-
164
-
165
-
166
-
167
-
168
-
169
-
170
-
171
-
172
-
173
-
174
-
175
-
176
-
177
-
178
-
179
-
180
-
181
-
182
-
183
-
184
-
185
-
186
-
187
-
188
-
189
-
190
-
191
-
192
-
193
-
194
-
195
-
196
 |
 |

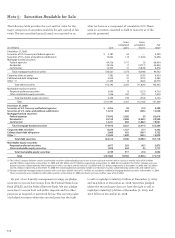
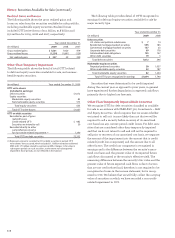
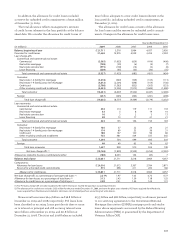
Note 4: Federal Funds Sold, Securities Purchased under Resale Agreements
and Other Short-Term Investments
The following table provides the detail of federal funds sold,
securities purchased under resale agreements and other
short-term investments.
December 31,
(in millions) 2009 2008
Federal funds sold and securities
purchased under resale agreements $ 8,042 8,439
Interest-earning deposits 31,668 39,890
Other short-term investments 1,175 1,104
Total $40,885 49,433
Federal Reserve Board (FRB) regulations require that each
of our subsidiary banks maintain reserve balances on deposit
with the Federal Reserve Banks. The average required reserve
balance was $2.4 billion in 2009 and $2.6 billion in 2008.
Federal law restricts the amount and the terms of both
credit and non-credit transactions between a bank and its
nonbank affiliates. They may not exceed 10% of the bank’s
capital and surplus (which for this purpose represents
Tier 1 and Tier 2 capital, as calculated under the risk-based
capital (RBC) guidelines, plus the balance of the allowance
for credit losses excluded from Tier 2 capital) with any single
nonbank affiliate and 20% of the bank’s capital and surplus
with all its nonbank affiliates. Transactions that are exten-
sions of credit may require collateral to be held to provide
added security to the bank. For further discussion of RBC,
see Note 25 in this Report.
Dividends paid by our subsidiary banks are subject to vari-
ous federal and state regulatory limitations. Dividends that
may be paid by a national bank without the express approval
of the Office of the Comptroller of the Currency (OCC) are
limited to that bank’s retained net profits for the preceding two
calendar years plus retained net profits up to the date of any
dividend declaration in the current calendar year. Retained
net profits, as defined by the OCC, consist of net income less
Note 3: Cash, Loan and Dividend Restrictions
dividends declared during the period. We also have state-
chartered subsidiary banks that are subject to state regula-
tions that limit dividends. Under those provisions, our national
and state-chartered subsidiary banks could have declared
additional dividends of $5.3 billion at December 31, 2009,
without obtaining prior regulatory approval. Our nonbank sub-
sidiaries are also limited by certain federal and state statutory
provisions and regulations covering the amount of dividends
that may be paid in any given year. Based on retained earnings
at December 31, 2009, our nonbank subsidiaries could have
declared additional dividends of $2.5 billion at December 31,
2009, without obtaining prior approval.
The FRB published clarifying supervisory guidance in first
quarter 2009, SR 09-4 Applying Supervisory Guidance and
Regulations on the Payment of Dividends, Stock Redemptions,
and Stock Repurchases at Bank Holding Companies, pertain-
ing to FRB’s criteria, assessment and approval process for
reductions in capital including the redemption of Troubled
Asset Relief Program (TARP) and the payment of dividends.
The effect of this guidance is to require the approval of the
FRB for the Company to repurchase or redeem common or
perpetual preferred stock as well as to raise the per share
dividend from its current level of $0.05 per share.
entities (GSEs), and domestic and foreign companies. At
December 31, 2009 and 2008, we pledged $14.8 billion and
$7.9 billion, respectively, under agreements that permit the
secured parties to sell or repledge the collateral. Pledged
collateral where the secured party cannot sell or repledge
was $434 million and $10 million, at December 31, 2009 and
2008, respectively.
We receive collateral from other entities under resale agree -
ments and securities borrowings. At December 31, 2009 and
2008, we received $31.4 billion and $7.9 billion, respectively,
for which we have the right to sell or repledge the collateral.
These amounts include securities we have sold or repledged
to others with a fair value of $29.7 billion at December 31,
2009, and $5.4 billion at December 31, 2008.
We pledge certain financial instruments that we own
to collateralize repurchase agreements and other securities
financings. The types of collateral we pledge include securi-
ties issued by federal agencies, government-sponsored