Wells Fargo 2009 Annual Report Download - page 171
Download and view the complete annual report
Please find page 171 of the 2009 Wells Fargo annual report below. You can navigate through the pages in the report by either clicking on the pages listed below, or by using the keyword search tool below to find specific information within the annual report.-
 1
1 -
2
-
3
-
4
-
5
-
6
-
7
-
8
-
9
-
10
-
11
-
12
-
13
-
14
-
15
-
16
-
17
-
18
-
19
-
20
-
21
-
22
-
23
-
24
-
25
-
26
-
27
-
28
-
29
-
30
-
31
-
32
-
33
-
34
-
35
-
36
-
37
-
38
-
39
-
40
-
41
-
42
-
43
-
44
-
45
-
46
-
47
-
48
-
49
-
50
-
51
-
52
-
53
-
54
-
55
-
56
-
57
-
58
-
59
-
60
-
61
-
62
-
63
-
64
-
65
-
66
-
67
-
68
-
69
-
70
-
71
-
72
-
73
-
74
-
75
-
76
-
77
-
78
-
79
-
80
-
81
-
82
-
83
-
84
-
85
-
86
-
87
-
88
-
89
-
90
-
91
-
92
-
93
-
94
-
95
-
96
-
97
-
98
-
99
-
100
-
101
-
102
-
103
-
104
-
105
-
106
-
107
-
108
-
109
-
110
-
111
-
112
-
113
-
114
-
115
-
116
-
117
-
118
-
119
-
120
-
121
-
122
-
123
-
124
-
125
-
126
-
127
-
128
-
129
-
130
-
131
-
132
-
133
-
134
-
135
-
136
-
137
-
138
-
139
-
140
-
141
-
142
-
143
-
144
-
145
-
146
-
147
-
148
-
149
-
150
-
151
-
152
-
153
-
154
-
155
-
156
-
157
-
158
-
159
-
160
-
 161
161 -
 162
162 -
 163
163 -
 164
164 -
 165
165 -
 166
166 -
 167
167 -
 168
168 -
 169
169 -
 170
170 -
 171
171 -
 172
172 -
 173
173 -
 174
174 -
 175
175 -
 176
176 -
 177
177 -
 178
178 -
 179
179 -
 180
180 -
 181
181 -
182
-
183
-
184
-
185
-
186
-
187
-
188
-
189
-
190
-
191
-
192
-
193
-
194
-
195
-
196
 |
 |

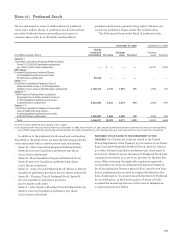
December 31,
(in millions) 2009 2008
Projected benefit obligation $10,719 9,661
Accumulated benefit obligation 10,706 9,423
Fair value of plan assets 9,112 7,863
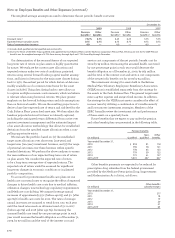
We seek to achieve the expected long-term rate of return
with a prudent level of risk given the benefit obligations of
the pension plans and their funded status. Our overall invest-
ment strategy is designed to provide our Cash Balance Plan
with a balance of long-term growth opportunities and short-
term benefit strategies while ensuring that risk is mitigated
through diversification across numerous asset classes and
various investment strategies. We target the asset allocation
for our Cash Balance Plan at a target mix range of 35-65%
equities, 30-50% fixed income, and approximately 10-15% in
real estate, venture capital, private equity and other invest-
ments. The target ranges referenced above account for the
employment of an asset allocation methodology designed to
overweight stocks or bonds when a compelling opportunity
exists. The Employee Benefit Review Committee (EBRC),
which includes several members of senior management,
formally reviews the investment risk and performance of
our Cash Balance Plan on a quarterly basis. Annual Plan
liability analysis and periodic asset/liability evaluations are
also conducted.
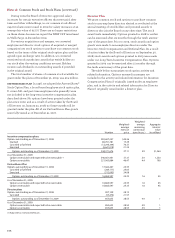
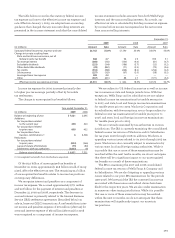
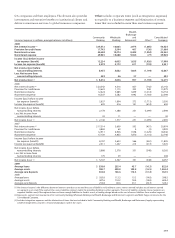
The table below provides information for pension plans
with benefit obligations in excess of plan assets.
Year ended December 31,
2009 2008
Pension Other Pension Other
benefits(1) benefits benefits(1) benefits
Discount rate 5.75% 5.75 6.75 6.75
Rate of compensation
increase (2) —— 4.0 —
(1) Includes both qualified and nonqualified benefits.
(2) Due to the freeze of the Wells Fargo qualified and supplemental Cash
Balance plans and the Wachovia Corporate Pension Plan, there is no rate
of compensation increase at December 31, 2009.
We use a consistent methodology to determine the discount
rate that is based on an established yield curve methodology.
This methodology incorporates a broad group of top quartile
Aa or higher rated bonds consisting of approximately 100-150
bonds. The discount rate is determined by matching this yield
curve with the timing and amounts of the expected benefit
payments for our plans.
The accumulated benefit obligation for the defined
benefit pension plans was $10.7 billion and $9.4 billion at
December 31, 2009 and 2008, respectively.
The weighted-average assumptions used to determine
the projected benefit obligation were:
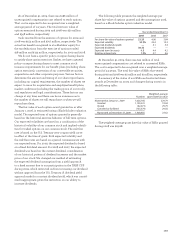
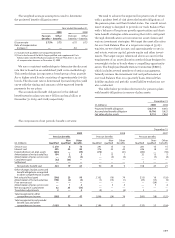
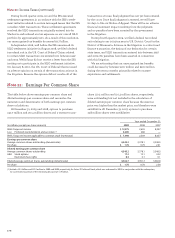
The components of net periodic benefit cost were:
December 31,
2009 2008 2007
Pension benefits Pension benefits Pension benefits
Non- Other Non- Other Non- Other
(in millions) Qualified qualified benefits Qualified qualified benefits Qualified qualified benefits
Service cost $ 210 8 13 291 15 13 281 15 15
Interest cost 595 43 83 276 22 40 246 18 41
Expected return on plan assets (643) — (29) (478) — (41) (452) — (36)
Amortization of net actuarial loss 19423 1 13 1 32 13 5
Amortization of prior service cost —(1)(3) — (5) (4) — (3) (4)
Curtailment gain (32) (33) — ——— ———
Settlement ——— ——— 1——
Net periodic benefit cost 324 19 67 90 45 9 108 43 21
Other changes in plan assets and
benefit obligations recognized
in other comprehensive income:
Net actuarial loss (gain) (346) 25 99 2,102 (16) 79 (213) 16 (126)
Amortization of net actuarial loss (194) (2) (3) (1) (13) (1) (33) (13) (5)
Prior service cost ——— ——— —(24)—
Amortization of prior service cost —13 —54 —34
Net loss (gain) in curtailment 32 33 (54) ——— ———
Translation adjustments 3— 2 (5) — (4) 3 — 2
Total recognized in other
comprehensive income (505) 57 47 2,096 (24) 78 (243) (18) (125)
Total recognized in net periodic
benefit cost and other
comprehensive income $(181) 76 114 2,186 21 87 (135) 25 (104)