Wells Fargo 2009 Annual Report Download - page 110
Download and view the complete annual report
Please find page 110 of the 2009 Wells Fargo annual report below. You can navigate through the pages in the report by either clicking on the pages listed below, or by using the keyword search tool below to find specific information within the annual report.-
 1
1 -
2
-
3
-
4
-
5
-
6
-
7
-
8
-
9
-
10
-
11
-
12
-
13
-
14
-
15
-
16
-
17
-
18
-
19
-
20
-
21
-
22
-
23
-
24
-
25
-
26
-
27
-
28
-
29
-
30
-
31
-
32
-
33
-
34
-
35
-
36
-
37
-
38
-
39
-
40
-
41
-
42
-
43
-
44
-
45
-
46
-
47
-
48
-
49
-
50
-
51
-
52
-
53
-
54
-
55
-
56
-
57
-
58
-
59
-
60
-
61
-
62
-
63
-
64
-
65
-
66
-
67
-
68
-
69
-
70
-
71
-
72
-
73
-
74
-
75
-
76
-
77
-
78
-
79
-
80
-
81
-
82
-
83
-
84
-
85
-
86
-
87
-
88
-
89
-
90
-
91
-
92
-
93
-
94
-
95
-
96
-
97
-
98
-
99
-
 100
100 -
 101
101 -
 102
102 -
 103
103 -
 104
104 -
 105
105 -
 106
106 -
 107
107 -
 108
108 -
 109
109 -
 110
110 -
 111
111 -
 112
112 -
 113
113 -
 114
114 -
 115
115 -
 116
116 -
 117
117 -
 118
118 -
 119
119 -
 120
120 -
121
-
122
-
123
-
124
-
125
-
126
-
127
-
128
-
129
-
130
-
131
-
132
-
133
-
134
-
135
-
136
-
137
-
138
-
139
-
140
-
141
-
142
-
143
-
144
-
145
-
146
-
147
-
148
-
149
-
150
-
151
-
152
-
153
-
154
-
155
-
156
-
157
-
158
-
159
-
160
-
161
-
162
-
163
-
164
-
165
-
166
-
167
-
168
-
169
-
170
-
171
-
172
-
173
-
174
-
175
-
176
-
177
-
178
-
179
-
180
-
181
-
182
-
183
-
184
-
185
-
186
-
187
-
188
-
189
-
190
-
191
-
192
-
193
-
194
-
195
-
196
 |
 |

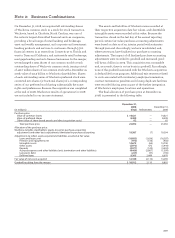
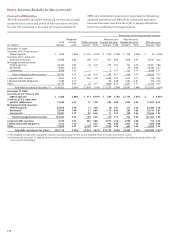
Note 1: Summary of Significant Accounting Policies (continued)
Year ended December 31,
(in millions) 2009 2008 2007
Transfers from trading assets to securities available for sale $ 854 — 1,268
Transfers from securities available for sale to loans 258 283 —
Transfers from MHFS to trading assets 2,993 ——
Transfers from MHFS to securities available for sale —544 7,949
Transfers from MHFS to MSRs 6,287 3,498 3,720
Transfers from MHFS to foreclosed assets 162 136 —
Transfers from (to) loans (from) to MHFS 144 (1,195) (2,133)
Transfers from (to) LHFS (from) to loans 111 (1,640) —
Transfers from loans to foreclosed assets 7,604 3,031 2,666
Net transfer from additional paid-in capital to noncontrolling interests 2,299 ——
Issuance of common and preferred stock for purchase accounting —22,672 2,125
SUPPLEMENTAL CASH FLOW INFORMATION Noncash investing and financing activities are presented below, including information
on transfers affecting MHFS, LHFS, and MSRs.
SUBSEQUENT EVENTS We have evaluated the effects of subse-
quent events that have occurred subsequent to period end
December 31, 2009, and through February 26, 2010, which
is the date we issued our financial statements. During this
period, there have been no material events that would require
recognition in our 2009 consolidated financial statements or
disclosure in the Notes to the financial statements.