Wells Fargo 2009 Annual Report Download - page 59
Download and view the complete annual report
Please find page 59 of the 2009 Wells Fargo annual report below. You can navigate through the pages in the report by either clicking on the pages listed below, or by using the keyword search tool below to find specific information within the annual report.-
 1
1 -
2
-
3
-
4
-
5
-
6
-
7
-
8
-
9
-
10
-
11
-
12
-
13
-
14
-
15
-
16
-
17
-
18
-
19
-
20
-
21
-
22
-
23
-
24
-
25
-
26
-
27
-
28
-
29
-
30
-
31
-
32
-
33
-
34
-
35
-
36
-
37
-
38
-
39
-
40
-
41
-
42
-
43
-
44
-
45
-
46
-
47
-
48
-
 49
49 -
 50
50 -
 51
51 -
 52
52 -
 53
53 -
 54
54 -
 55
55 -
 56
56 -
 57
57 -
 58
58 -
 59
59 -
 60
60 -
 61
61 -
 62
62 -
 63
63 -
 64
64 -
 65
65 -
 66
66 -
 67
67 -
 68
68 -
 69
69 -
70
-
71
-
72
-
73
-
74
-
75
-
76
-
77
-
78
-
79
-
80
-
81
-
82
-
83
-
84
-
85
-
86
-
87
-
88
-
89
-
90
-
91
-
92
-
93
-
94
-
95
-
96
-
97
-
98
-
99
-
100
-
101
-
102
-
103
-
104
-
105
-
106
-
107
-
108
-
109
-
110
-
111
-
112
-
113
-
114
-
115
-
116
-
117
-
118
-
119
-
120
-
121
-
122
-
123
-
124
-
125
-
126
-
127
-
128
-
129
-
130
-
131
-
132
-
133
-
134
-
135
-
136
-
137
-
138
-
139
-
140
-
141
-
142
-
143
-
144
-
145
-
146
-
147
-
148
-
149
-
150
-
151
-
152
-
153
-
154
-
155
-
156
-
157
-
158
-
159
-
160
-
161
-
162
-
163
-
164
-
165
-
166
-
167
-
168
-
169
-
170
-
171
-
172
-
173
-
174
-
175
-
176
-
177
-
178
-
179
-
180
-
181
-
182
-
183
-
184
-
185
-
186
-
187
-
188
-
189
-
190
-
191
-
192
-
193
-
194
-
195
-
196
 |
 |

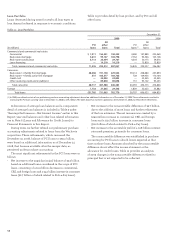
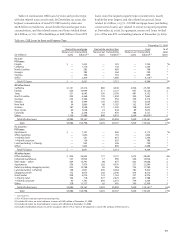
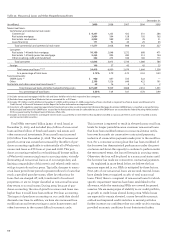
The deterioration in specific segments of the Home Equity
portfolios required a targeted approach to managing these
assets. In fourth quarter 2007, a liquidating portfolio was
identified, consisting of home equity loans generated through
the wholesale channel not behind a Wells Fargo first mortgage,
and home equity loans acquired through correspondents.
The liquidating portion of the Home Equity portfolio was
$8.4 billion at December 31, 2009, compared with $10.3 billion
a year ago. The loans in this liquidating portfolio represent
about 1% of total loans outstanding at December 31, 2009, and
contain some of the highest risk in our $123.8 billion Home
Equity portfolios, with a loss rate of 11.17% compared with
3.28% for the core portfolio. The loans in the liquidating
portfolio are largely concentrated in geographic markets
that have experienced the most abrupt and steepest declines
in housing prices. The core portfolio was $115.4 billion at
December 31, 2009, of which 97% was originated through
the retail channel and approximately 17% of the outstanding
balance was in a first lien position. Table 23 includes the credit
attributes of these two portfolios. California loans represent
the largest state concentration in each of these portfolios and
have experienced among the highest early-term delinquency
and loss rates.
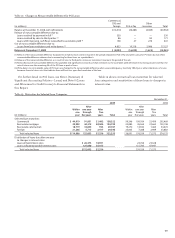
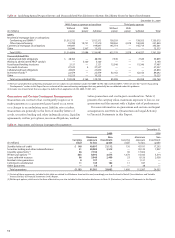
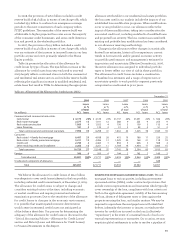
Table 23: Home Equity Portfolios (1)
% of loans
two payments
Outstanding balance or more past due Loss rate
December 31,December 31,December 31,
(in millions) 2009 2008 2009 2008 2009 2008
Core portfolio (2)
California $ 30,264 31,544 4.12% 2.95 5.42 2.93
Florida 12,038 11,781 5.48 3.36 4.73 2.79
New Jersey 8,379 7,888 2.50 1.41 1.30 0.66
Virginia 5,855 5,688 1.91 1.50 1.06 1.08
Pennsylvania 5,051 5,043 2.03 1.10 1.49 0.38
Other 53,811 56,415 2.85 1.97 2.44 1.14
Total 115,398 118,359 3.35 2.27 3.28 1.70
Liquidating portfolio
California 3,205 4,008 8.78 6.69 16.74 9.26
Florida 408 513 9.45 8.41 16.90 11.24
Arizona 193 244 10.46 7.40 18.57 8.58
Texas 154 191 1.94 1.27 2.56 1.56
Minnesota 108 127 4.15 3.79 7.58 5.74
Other 4,361 5,226 5.06 3.28 6.46 3.40
Total 8,429 10,309 6.74 4.93 11.17 6.18
Total core and liquidating portfolios $123,827 128,668 3.58 2.48 3.88 2.10
(1) Consists of real estate 1-4 family junior lien mortgages and lines of credit secured by real estate from all groups, excluding PCI loans.
(2) Includes equity lines of credit and closed-end second liens associated with the Pick-a-Pay portfolio totaling $1.8 billion at December 31, 2009, and $2.1 billion at
December 31, 2008.
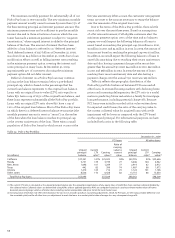
PICK-A-PAY PORTFOLIO Our Pick-a-Pay portfolio, which we
acquired in the Wachovia merger, had an unpaid principal
balance of $103.7 billion and a carrying value of $85.2 billion
at December 31, 2009. This portfolio includes loans that offer
payment options (Pick-a-Pay option payment loans), loans
that were originated without the option payment feature and
loans that no longer offer the option feature as a result of our
modification efforts since the acquisition. At December 31,
2009, the unpaid principal balance of Pick-a-Pay option pay-
ment loans totaled $73.1 billion, or 70% of the total Pick-a-Pay
portfolio, down significantly from $101.3 billion, or 86%,
at December 31, 2008, primarily due to loan modifications,
paid-in full loans and net charge-offs. The Pick-a-Pay portfolio
is a liquidating portfolio as Wachovia ceased originating new
Pick-a-Pay loans in 2008. Equity lines of credit and closed-end
second liens associated with Pick-a-Pay loans are reported in
the Home Equity core portfolio.
PCI loans in the Pick-a-Pay portfolio had an unpaid
principal balance of $55.1 billion and a carrying value of
$37.0 billion at December 31, 2009. The carrying value of the
PCI loans is net of purchase accounting write-downs to reflect
their fair value at acquisition. Upon acquisition, we recorded a
$22.4 billion write-down in purchase accounting on Pick-a-Pay
loans that were impaired. Losses to date on this portfolio are
reasonably in line with management’s original expectations. Our
most recent life-of-loan loss projections show an improvement
driven in part by extensive and currently successful modification
efforts as well as improving delinquency roll rate trends and
further stabilization in the housing market.
Pick-a-Pay option payment loans may be adjustable or
fixed rate. They are home mortgages on which the customer
has the option each month to select from among four payment
options: (1) a minimum payment as described below, (2) an
interest-only payment, (3) a fully amortizing 15-year payment,
or (4) a fully amortizing 30-year payment.