Wells Fargo 2009 Annual Report Download - page 128
Download and view the complete annual report
Please find page 128 of the 2009 Wells Fargo annual report below. You can navigate through the pages in the report by either clicking on the pages listed below, or by using the keyword search tool below to find specific information within the annual report.-
 1
1 -
2
-
3
-
4
-
5
-
6
-
7
-
8
-
9
-
10
-
11
-
12
-
13
-
14
-
15
-
16
-
17
-
18
-
19
-
20
-
21
-
22
-
23
-
24
-
25
-
26
-
27
-
28
-
29
-
30
-
31
-
32
-
33
-
34
-
35
-
36
-
37
-
38
-
39
-
40
-
41
-
42
-
43
-
44
-
45
-
46
-
47
-
48
-
49
-
50
-
51
-
52
-
53
-
54
-
55
-
56
-
57
-
58
-
59
-
60
-
61
-
62
-
63
-
64
-
65
-
66
-
67
-
68
-
69
-
70
-
71
-
72
-
73
-
74
-
75
-
76
-
77
-
78
-
79
-
80
-
81
-
82
-
83
-
84
-
85
-
86
-
87
-
88
-
89
-
90
-
91
-
92
-
93
-
94
-
95
-
96
-
97
-
98
-
99
-
100
-
101
-
102
-
103
-
104
-
105
-
106
-
107
-
108
-
109
-
110
-
111
-
112
-
113
-
114
-
115
-
116
-
117
-
 118
118 -
 119
119 -
 120
120 -
 121
121 -
 122
122 -
 123
123 -
 124
124 -
 125
125 -
 126
126 -
 127
127 -
 128
128 -
 129
129 -
 130
130 -
 131
131 -
 132
132 -
 133
133 -
 134
134 -
 135
135 -
 136
136 -
 137
137 -
 138
138 -
139
-
140
-
141
-
142
-
143
-
144
-
145
-
146
-
147
-
148
-
149
-
150
-
151
-
152
-
153
-
154
-
155
-
156
-
157
-
158
-
159
-
160
-
161
-
162
-
163
-
164
-
165
-
166
-
167
-
168
-
169
-
170
-
171
-
172
-
173
-
174
-
175
-
176
-
177
-
178
-
179
-
180
-
181
-
182
-
183
-
184
-
185
-
186
-
187
-
188
-
189
-
190
-
191
-
192
-
193
-
194
-
195
-
196
 |
 |

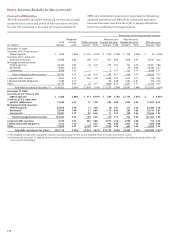
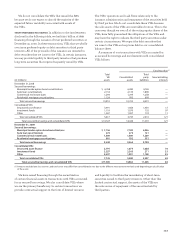
Other
Total Debt and commitments
QSPE equity Servicing and Net
(in millions) assets(1) interests(2) assets Derivatives guarantees assets
December 31, 2008 Carrying value –asset (liability)
Residential mortgage loan securitizations (3):
Conforming (4) $ 1,008,824 10,207 11,715 — (426) 21,496
Other/nonconforming 313,447 7,262 2,276 30 (85) 9,483
Commercial mortgage securitizations (3) 320,399 1,452 918 524 — 2,894
Auto loan securitizations 4,133 72 — 43 — 115
Student loan securitizations 2,765 76 57 — — 133
Other 11,877 74 — (3) — 71
Total $ 1,661,345 19,143 14,966 594 (511) 34,192
Maximum exposure to loss
Residential mortgage loan securitizations (3):
Conforming (4) $ 10,207 11,715 — 2,697 24,619
Other/nonconforming 7,262 2,276 300 71 9,909
Commercial mortgage securitizations (3) 1,452 918 524 — 2,894
Auto loan securitizations 72 — 43 — 115
Student loan securitizations 76 57 — — 133
Other 74 — 1,465 37 1,576
Total $ 19,143 14,966 2,332 2,805 39,246
December 31, 2009 Carrying value –asset (liability)
Residential mortgage loan securitizations:
Conforming (4) $1,150,515 5,846 13,949 — (869) 18,926
Other/nonconforming 251,850 11,683 1,538 16 (15) 13,222
Commercial mortgage securitizations 345,561 3,760 696 489 — 4,945
Auto loan securitizations 2,285 137 — 21 — 158
Student loan securitizations 2,637 123 50 — — 173
Other 8,391 57 — 4 — 61
Total $1,761,239 21,606 16,233 530 (884) 37,485
Maximum exposure to loss
Residential mortgage loan securitizations:
Conforming (4) $ 5,846 13,949 — 4,567 24,362
Other/nonconforming 11,683 1,538 30 218 13,469
Commercial mortgage securitizations 3,760 696 766 — 5,222
Auto loan securitizations 137 — 21 — 158
Student loan securitizations 123 50 — — 173
Other 57 — 78 — 135
Total $21,606 16,233 895 4,785 43,519
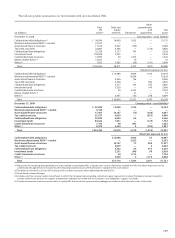
(1) Represents the remaining principal balance of assets held by QSPEs using the most current information available.
(2) Excludes certain debt securities held related to loans serviced for FNMA, FHLMC and GNMA.
(3) Certain balances have been revised to reflect additionally identified residential mortgage QSPEs, as well as to reflect removal of commercial mortgage asset transfers that
were subsequently determined not to be transfers to QSPEs.
(4) Conforming residential mortgage loan securitizations are those that are guaranteed by GSEs. Other commitments and guarantees include amounts related to loans sold
to QSPEs that we may be required to repurchase, or otherwise indemnify or reimburse the investor or insurer for losses incurred, due to material breach of contractual
representations and warranties. The maximum exposure to loss for material breach of contractual representations and warranties represents a stressed case estimate
we utilize for determining stressed case regulatory capital needs and has been revised as of December 31, 2008, to conform with the 2009 basis of determination.
A summary of our involvements with QSPEs follows:
in the preceding table, represents estimated loss that would
be incurred under severe, hypothetical circumstances, for
which we believe the possibility of occurrence is extremely
remote, such as where the value of our interests and any asso-
ciated collateral declines to zero, without any consideration
of recovery or offset from any economic hedges. Accordingly,
this required disclosure is not an indication of expected loss.
“Maximum exposure to loss” represents the carrying
value of our involvement with off-balance sheet QSPEs plus
remaining undrawn liquidity and lending commitments,
notional amount of net written derivative contracts, and gen-
erally the notional amount of, or stressed loss estimate for,
other commitments and guarantees. Maximum exposure to
loss is a required disclosure under GAAP and, as presented
Note 8: Securitizations and Variable Interest Entities (continued)