Wells Fargo 2009 Annual Report Download - page 66
Download and view the complete annual report
Please find page 66 of the 2009 Wells Fargo annual report below. You can navigate through the pages in the report by either clicking on the pages listed below, or by using the keyword search tool below to find specific information within the annual report.-
 1
1 -
2
-
3
-
4
-
5
-
6
-
7
-
8
-
9
-
10
-
11
-
12
-
13
-
14
-
15
-
16
-
17
-
18
-
19
-
20
-
21
-
22
-
23
-
24
-
25
-
26
-
27
-
28
-
29
-
30
-
31
-
32
-
33
-
34
-
35
-
36
-
37
-
38
-
39
-
40
-
41
-
42
-
43
-
44
-
45
-
46
-
47
-
48
-
49
-
50
-
51
-
52
-
53
-
54
-
55
-
 56
56 -
 57
57 -
 58
58 -
 59
59 -
 60
60 -
 61
61 -
 62
62 -
 63
63 -
 64
64 -
 65
65 -
 66
66 -
 67
67 -
 68
68 -
 69
69 -
 70
70 -
 71
71 -
 72
72 -
 73
73 -
 74
74 -
 75
75 -
 76
76 -
77
-
78
-
79
-
80
-
81
-
82
-
83
-
84
-
85
-
86
-
87
-
88
-
89
-
90
-
91
-
92
-
93
-
94
-
95
-
96
-
97
-
98
-
99
-
100
-
101
-
102
-
103
-
104
-
105
-
106
-
107
-
108
-
109
-
110
-
111
-
112
-
113
-
114
-
115
-
116
-
117
-
118
-
119
-
120
-
121
-
122
-
123
-
124
-
125
-
126
-
127
-
128
-
129
-
130
-
131
-
132
-
133
-
134
-
135
-
136
-
137
-
138
-
139
-
140
-
141
-
142
-
143
-
144
-
145
-
146
-
147
-
148
-
149
-
150
-
151
-
152
-
153
-
154
-
155
-
156
-
157
-
158
-
159
-
160
-
161
-
162
-
163
-
164
-
165
-
166
-
167
-
168
-
169
-
170
-
171
-
172
-
173
-
174
-
175
-
176
-
177
-
178
-
179
-
180
-
181
-
182
-
183
-
184
-
185
-
186
-
187
-
188
-
189
-
190
-
191
-
192
-
193
-
194
-
195
-
196
 |
 |
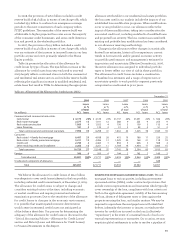
Wells Fargo Financial auto portfolio net charge-offs for 2008
were $1.2 billion (4.50% of average auto loans), compared with
$1.0 billion (3.45%) in 2007. While we continued to reduce
the size of this portfolio and limited additional growth, the
economic environment adversely affected portfolio results.
We remained focused on our loss mitigation strategies; how-
ever, credit performance deteriorated as a result of increased
unemployment and depressed used car values, resulting in
higher than expected losses for 2008.
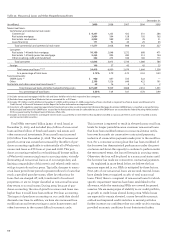
ALLOWANCE FOR CREDIT LOSSES The allowance for credit
losses, which consists of the allowance for loan losses and the
reserve for unfunded credit commitments, is management’s
estimate of credit losses inherent in the loan portfolio at
the balance sheet date and excludes PCI loans which have a
nonaccretable difference to absorb losses and loans carried
at fair value. The detail of the changes in the allowance for
credit losses, including charge-offs and recoveries by loan
category, is in Note 6 (Loans and Allowance for Credit
Losses) to Financial Statements in this Report.
We employ a disciplined process and methodology to
establish our allowance for loan losses each quarter. This
process takes into consideration many factors, including
historical and forecasted loss trends, loan-level credit quality
ratings and loan grade specific loss factors. The process
involves difficult, subjective, and complex judgments. In
addition, we review several credit ratio trends, such as the
ratio of the allowance for loan losses to nonaccrual loans and
the ratio of the allowance for loan losses to net charge-offs.
These trends are not determinative of the adequacy of the
allowance as we use several analytical tools in determining
the adequacy of the allowance.
For individually graded (typically commercial) portfolios,
we generally use loan-level credit quality ratings, which are
based on borrower information and strength of collateral,
combined with historically based grade specific loss factors.
The allowance for individually rated nonaccruing commercial
loans with an outstanding exposure of $5 million or greater is
determined through an individual impairment analysis. For
statistically evaluated portfolios (typically consumer), we gen-
erally leverage models which use credit-related characteris-
tics such as credit rating scores, delinquency migration rates,
vintages, and portfolio concentrations to estimate loss con-
tent. Additionally, the allowance for consumer TDRs is based
on the risk characteristics of the modified loans and the resul-
tant estimated cash flows discounted at the pre-modification
effective yield of the loan. While the allowance is determined
using product and business segment estimates, it is available
to absorb losses in the entire loan portfolio.
At December 31, 2009, the allowance for loan losses totaled
$24.5 billion (3.13% of total loans), compared with $21.0 billion
(2.43%), at December 31, 2008. The allowance for credit losses
was $25.0 billion (3.20% of total loans) at December 31, 2009,
and $21.7 billion (2.51%) at December 31, 2008. The allowance
for credit losses included $333 million related to PCI loans
acquired from Wachovia. Loans acquired from Wachovia are
included in total loans net of related purchase accounting
write-downs. The reserve for unfunded credit commitments
was $515 million at December 31, 2009, and $698 million at
December 31, 2008. In addition to the allowance for credit
losses there was $22.9 billion of nonaccretable difference at
December 31, 2009, to absorb losses for PCI loans.
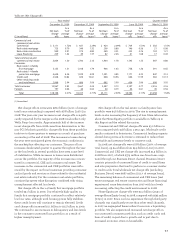
The ratio of the allowance for credit losses to total nonac-
crual loans was 103% and 319% at December 31, 2009 and
2008, respectively. The decrease in this ratio reflects some
deterioration in the underlying loan portfolio. However, the
trend in the ratio is also profoundly affected by the impact
of purchase accounting eliminating virtually all legacy
Wachovia nonaccrual loans at December 31, 2008. In general,
this ratio may fluctuate significantly from period to period
due to such factors as the mix of loan types in the portfolio,
borrower credit strength and the value and marketability of
collateral. Over half of nonaccrual loans were home mort-
gages, auto and other consumer loans at December 31, 2009.
The ratio of the allowance for loan losses to annual net
charge-offs was 135%, 268% and 150% at December 31, 2009,
2008 and 2007, respectively. The decline in this ratio from
2008 is largely due to the fact that only legacy Wells Fargo
losses were included in 2008, but the allowance anticipated
emerging losses from the combined portfolios. The allowance
as of December 31, 2008, anticipated the increased charge-
offs that occurred over 2009, while the allowance for
December 31, 2009, anticipates inherent losses that will be
recognized as charge-offs in future periods. When anticipated
charge-offs are projected to decline from current levels, this
ratio will shrink. As more of the portfolio experiences charge-
offs, charge-off levels continue to increase and the remaining
portfolio is anticipated to consist of higher quality vintage
loans subjected to tightened underwriting standards adminis-
tered during the downturn in the credit cycle. As charge-off
levels peak, we anticipate coverage levels will shrink until
charge-off levels return to more normalized levels. This ratio
may fluctuate significantly from period to period due to many
factors, including general economic conditions, customer
credit strength and the marketability of collateral. The
allowance for loan losses reflects management’s estimate
of credit losses inherent in the loan portfolio based on loss
emergence periods of the respective loans, underlying eco-
nomic and market conditions, among other factors. See the
“Critical Accounting Policies – Allowance for Credit Losses”
section in this Report for additional information. The
allowance for loan losses at December 31, 2008, also includes
the allowance acquired from the Wachovia acquisition (except
for PCI loans), while 2008 net charge-offs do not include
activity related to Wachovia.
The provision for credit losses totaled $21.7 billion in 2009,
$16.0 billion in 2008 and $4.9 billion in 2007. In 2009, the
provision of $21.7 billion included a credit reserve build of
$3.5 billion, which was primarily driven by three factors:
(1) deterioration in economic conditions that increased the
projected losses in our commercial portfolios, (2) additional
reserves associated with loan modification programs
designed to keep qualifying borrowers in their homes, and
(3) the establishment of additional reserves for PCI loans.