Wells Fargo 2009 Annual Report Download - page 54
Download and view the complete annual report
Please find page 54 of the 2009 Wells Fargo annual report below. You can navigate through the pages in the report by either clicking on the pages listed below, or by using the keyword search tool below to find specific information within the annual report.-
 1
1 -
2
-
3
-
4
-
5
-
6
-
7
-
8
-
9
-
10
-
11
-
12
-
13
-
14
-
15
-
16
-
17
-
18
-
19
-
20
-
21
-
22
-
23
-
24
-
25
-
26
-
27
-
28
-
29
-
30
-
31
-
32
-
33
-
34
-
35
-
36
-
37
-
38
-
39
-
40
-
41
-
42
-
43
-
 44
44 -
 45
45 -
 46
46 -
 47
47 -
 48
48 -
 49
49 -
 50
50 -
 51
51 -
 52
52 -
 53
53 -
 54
54 -
 55
55 -
 56
56 -
 57
57 -
 58
58 -
 59
59 -
 60
60 -
 61
61 -
 62
62 -
 63
63 -
 64
64 -
65
-
66
-
67
-
68
-
69
-
70
-
71
-
72
-
73
-
74
-
75
-
76
-
77
-
78
-
79
-
80
-
81
-
82
-
83
-
84
-
85
-
86
-
87
-
88
-
89
-
90
-
91
-
92
-
93
-
94
-
95
-
96
-
97
-
98
-
99
-
100
-
101
-
102
-
103
-
104
-
105
-
106
-
107
-
108
-
109
-
110
-
111
-
112
-
113
-
114
-
115
-
116
-
117
-
118
-
119
-
120
-
121
-
122
-
123
-
124
-
125
-
126
-
127
-
128
-
129
-
130
-
131
-
132
-
133
-
134
-
135
-
136
-
137
-
138
-
139
-
140
-
141
-
142
-
143
-
144
-
145
-
146
-
147
-
148
-
149
-
150
-
151
-
152
-
153
-
154
-
155
-
156
-
157
-
158
-
159
-
160
-
161
-
162
-
163
-
164
-
165
-
166
-
167
-
168
-
169
-
170
-
171
-
172
-
173
-
174
-
175
-
176
-
177
-
178
-
179
-
180
-
181
-
182
-
183
-
184
-
185
-
186
-
187
-
188
-
189
-
190
-
191
-
192
-
193
-
194
-
195
-
196
 |
 |

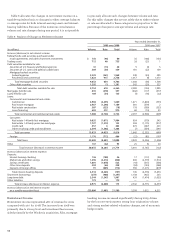
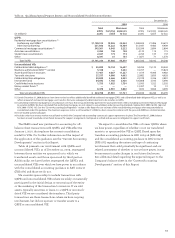
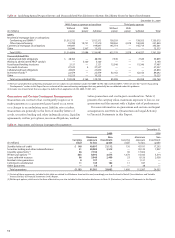
Table 16: Qualifying Special Purpose Entities and Unconsolidated Variable Interest Entities Total Entity Assets by Type of Involvement
December 31, 2009
Wells Fargo as sponsor or transferor Third party sponsor
Without With Without With
(in millions) power power Subtotal power power Subtotal Total
QSPEs
Residential mortgage loan securitizations:
Conforming and GNMA (1) $1,012,312 — 1,012,312 138,203 — 138,203 1,150,515
Other/nonconforming 91,789 19,721 111,510 138,262 2,078 140,340 251,850
Commercial mortgage securitizations 199,847 — 199,847 145,714 — 145,714 345,561
Other 10,946 2,367 13,313 — — — 13,313
Total QSPEs $1,314,894 22,088 1,336,982 422,179 2,078 424,257 1,761,239
Unconsolidated VIEs
Collateralized debt obligations $ 48,350 — 48,350 7,549 — 7,549 55,899
Wachovia administered ABCP conduit — 5,160 5,160 — — — 5,160
Asset-based lending structures 2,121 — 2,121 15,346 — 15,346 17,467
Tax credit structures 27,533 4 27,537 — — — 27,537
Collateralized loan obligations 23,830 — 23,830 — — — 23,830
Investment funds (2) 22,479 — 22,479 62,163 — 62,163 84,642
Other 10,225 — 10,225 — — — 10,225
Total unconsolidated VIEs $ 134,538 5,164 139,702 85,058 — 85,058 224,760
(1) We have concluded that conforming mortgages are not subject to consolidation under ASU 2009-16 (FAS 166) and ASU 2009-17 (FAS 167). See the “Current Accounting
Developments” section in this Report for our estimate of the nonconforming mortgages that may potentially be consolidated under this guidance.
(2) Includes investment funds that are subject to deferral from application of ASU 2009-17 (FAS 167).
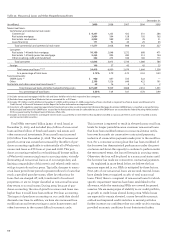
Table 17: Guarantees and Certain Contingent Arrangements
December 31,
2009 2008
Maximum Non- Maximum Non-
Carrying exposure investment Carrying exposure investment
(in millions) value to loss grade value to loss grade
Standby letters of credit $ 148 49,997 21,112 130 47,191 17,293
Securities lending and other indemnifications 51 20,002 2,512 — 30,120 1,907
Liquidity agreements (1) 66 7,744 — 30 17,602 —
Written put options (1)(2) 803 8,392 3,674 1,376 10,182 5,314
Loans sold with recourse 96 5,049 2,400 53 6,126 2,038
Residual value guarantees 8 197 — — 1,121 —
Contingent consideration 11 145 102 11 187 —
Other guarantees —55 2 —38—
Total guarantees $1,183 91,581 29,802 1,600 112,567 26,552
(1) Certain of these agreements included in this table are related to off-balance sheet entities and, accordingly, are also disclosed in Note 8 (Securitizations and Variable
Interest Entities) to Financial Statements in this Report.
(2) Written put options, which are in the form of derivatives, are also included in the derivative disclosures in Note 15 (Derivatives) to Financial Statements in this Report.
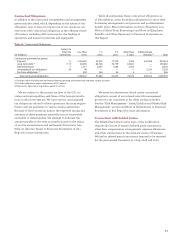
Guarantees and Certain Contingent Arrangements
Guarantees are contracts that contingently require us to
make payments to a guaranteed party based on an event
or a change in an underlying asset, liability, rate or index.
Guarantees are generally in the form of standby letters of
credit, securities lending and other indemnifications, liquidity
agreements, written put options, recourse obligations, residual
value guarantees and contingent consideration. Table 17
presents the carrying value, maximum exposure to loss on our
guarantees and the amount with a higher risk of performance.
For more information on guarantees and certain contingent
arrangements, see Note 14 (Guarantees and Legal Actions)
to Financial Statements in this Report.