Wells Fargo 2009 Annual Report Download - page 65
Download and view the complete annual report
Please find page 65 of the 2009 Wells Fargo annual report below. You can navigate through the pages in the report by either clicking on the pages listed below, or by using the keyword search tool below to find specific information within the annual report.-
 1
1 -
2
-
3
-
4
-
5
-
6
-
7
-
8
-
9
-
10
-
11
-
12
-
13
-
14
-
15
-
16
-
17
-
18
-
19
-
20
-
21
-
22
-
23
-
24
-
25
-
26
-
27
-
28
-
29
-
30
-
31
-
32
-
33
-
34
-
35
-
36
-
37
-
38
-
39
-
40
-
41
-
42
-
43
-
44
-
45
-
46
-
47
-
48
-
49
-
50
-
51
-
52
-
53
-
54
-
 55
55 -
 56
56 -
 57
57 -
 58
58 -
 59
59 -
 60
60 -
 61
61 -
 62
62 -
 63
63 -
 64
64 -
 65
65 -
 66
66 -
 67
67 -
 68
68 -
 69
69 -
 70
70 -
 71
71 -
 72
72 -
 73
73 -
 74
74 -
 75
75 -
76
-
77
-
78
-
79
-
80
-
81
-
82
-
83
-
84
-
85
-
86
-
87
-
88
-
89
-
90
-
91
-
92
-
93
-
94
-
95
-
96
-
97
-
98
-
99
-
100
-
101
-
102
-
103
-
104
-
105
-
106
-
107
-
108
-
109
-
110
-
111
-
112
-
113
-
114
-
115
-
116
-
117
-
118
-
119
-
120
-
121
-
122
-
123
-
124
-
125
-
126
-
127
-
128
-
129
-
130
-
131
-
132
-
133
-
134
-
135
-
136
-
137
-
138
-
139
-
140
-
141
-
142
-
143
-
144
-
145
-
146
-
147
-
148
-
149
-
150
-
151
-
152
-
153
-
154
-
155
-
156
-
157
-
158
-
159
-
160
-
161
-
162
-
163
-
164
-
165
-
166
-
167
-
168
-
169
-
170
-
171
-
172
-
173
-
174
-
175
-
176
-
177
-
178
-
179
-
180
-
181
-
182
-
183
-
184
-
185
-
186
-
187
-
188
-
189
-
190
-
191
-
192
-
193
-
194
-
195
-
196
 |
 |

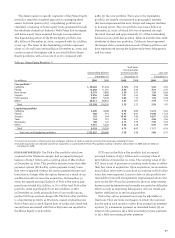
Net charge-offs in 2009 were $18.2 billion (2.21% of average
total loans outstanding) compared with $7.8 billion (1.97%) in
2008. The year over year increase in net charge-offs is signifi-
cantly impacted by the merger as the 2008 totals reflect only
Wells Fargo loss results. Approximately half of the increase
in net charge-offs from 2008 came from deterioration in the
non-PCI Wachovia portfolio; charge-offs from these portfolios
took two to three quarters to emerge as a result of purchase
accounting at the end of 2008. The increases in losses during
the year were anticipated given the economic conditions in
the marketplace affecting our customers. The pace of loss
increases decelerated quarter to quarter throughout the year
as the loss levels in several portfolios have seen some level
of stabilization. While increases in losses were distributed
across the portfolio, the majority of the increase was concen-
trated in commercial, CRE and consumer real estate. The
increases in the commercial and CRE portfolios were influ-
enced by the impact on those businesses providing consumer
cyclical goods and services or those related to the residential
real estate industry. For the consumer real estate portfolios,
continued property value disruption combined with rising
unemployment affected loss levels.
Net charge-offs in the 1-4 family first mortgage portfolio
totaled $3.1 billion in 2009. Our relatively high-quality 1-4
family first mortgage portfolio continued to reflect relatively
low loss rates, although until housing prices fully stabilize,
these credit losses will continue to remain elevated. Credit
card charge-offs increased $1.1 billion to $2.5 billion in 2009.
We continued to see increases in delinquency and loss levels
in the consumer unsecured loan portfolios as a result of
higher unemployment.
Net charge-offs in the real estate 1-4 family junior lien
portfolio were $4.6 billion in 2009. The rise in unemployment
levels is also increasing the frequency of loss. More information
about the Home Equity portfolio is available in Table 23 in
this Report and the related discussion.
Commercial and CRE net charge-offs were $5.0 billion in
2009 compared with $1.8 billion a year ago. Wholesale credit
results continued to deteriorate. Commercial lending requests
slowed during 2009 as borrowers continued to reduce their
receivable and inventory levels to conserve cash.
In 2008, net charge-offs were $7.8 billion (1.97% of average
total loans), up $4.3 billion from $3.5 billion (1.03%) in 2007.
Commercial and CRE net charge-offs increased $1.3 billion in
2008 from 2007, of which $379 million was from loans origi-
nated through our Business Direct channel. Business Direct
consists primarily of unsecured lines of credit to small firms
and sole proprietors that tend to perform in a manner similar
to credit cards. Total wholesale net charge-offs (excluding
Business Direct) were $967 million (0.11% of average loans).
The remaining balance of commercial and CRE loans (real
estate mortgage, real estate construction and lease financing)
experienced some deterioration from 2007 with loss levels
increasing, reflecting the credit environment in 2008.
Home Equity net charge-offs were $2.2 billion (2.59% of
average Home Equity loans) in 2008, compared with $595 million
(0.73%) in 2007. Since our loss experience through third party
channels was significantly worse than other retail channels,
in 2007 we segregated these indirect loans into a liquidating
portfolio. We also experienced increased net charge-offs in
our unsecured consumer portfolios, such as credit cards and
lines of credit, in part due to growth and in part due to
increased economic stress in households.
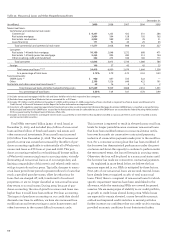
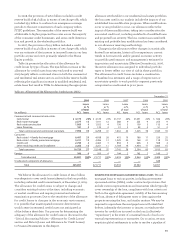
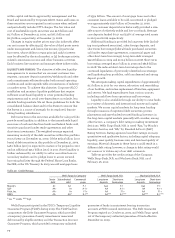
Table 28: Net Charge-offs
Year ended Quarter ended
December 31, 2009 December 31, 2009 September 30, 2009 June 30, 2009 March 31, 2009
As aAs aAs aAs aAs a
Net loan % of Net loan % of Net loan % of Net loan % of Net loan % of
charge- average charge- average charge- average charge- average charge- average
($ in millions) offs loans offs loans(1) offs loans(1) offs loans(1) offs loans(1)
Commercial and
commercial real estate:
Commercial $ 3,111 1.72% $ 927 2.24% $ 924 2.09% $ 704 1.51% $ 556 1.15%
Real estate mortgage 725 0.70 349 1.32 209 0.80 146 0.56 21 0.08
Real estate construction 959 2.91 375 4.82 249 3.01 232 2.76 103 1.21
Lease financing 209 1.42 49 1.37 82 2.26 61 1.68 17 0.43
Total commercial and
commercial real estate 5,004 1.50 1,700 2.15 1,464 1.78 1,143 1.35 697 0.80
Consumer:
Real estate 1-4 family
first mortgage 3,133 1.31 1,018 1.74 966 1.63 758 1.26 391 0.65
Real estate 1-4 family
junior lien mortgage 4,638 4.34 1,329 5.09 1,291 4.85 1,171 4.33 847 3.12
Credit card 2,528 10.82 634 10.61 648 10.96 664 11.59 582 10.13
Other revolving credit
and installment 2,668 2.94 686 3.06 682 3.00 604 2.66 696 3.05
Total consumer 12,967 2.82 3,667 3.24 3,587 3.13 3,197 2.77 2,516 2.16
Foreign 197 0.64 46 0.62 60 0.79 46 0.61 45 0.56
Total $18,168 2.21% $5,413 2.71% $5,111 2.50% $4,386 2.11% $3,258 1.54%
(1) Annualized