Wells Fargo 2009 Annual Report Download - page 158
Download and view the complete annual report
Please find page 158 of the 2009 Wells Fargo annual report below. You can navigate through the pages in the report by either clicking on the pages listed below, or by using the keyword search tool below to find specific information within the annual report.-
 1
1 -
2
-
3
-
4
-
5
-
6
-
7
-
8
-
9
-
10
-
11
-
12
-
13
-
14
-
15
-
16
-
17
-
18
-
19
-
20
-
21
-
22
-
23
-
24
-
25
-
26
-
27
-
28
-
29
-
30
-
31
-
32
-
33
-
34
-
35
-
36
-
37
-
38
-
39
-
40
-
41
-
42
-
43
-
44
-
45
-
46
-
47
-
48
-
49
-
50
-
51
-
52
-
53
-
54
-
55
-
56
-
57
-
58
-
59
-
60
-
61
-
62
-
63
-
64
-
65
-
66
-
67
-
68
-
69
-
70
-
71
-
72
-
73
-
74
-
75
-
76
-
77
-
78
-
79
-
80
-
81
-
82
-
83
-
84
-
85
-
86
-
87
-
88
-
89
-
90
-
91
-
92
-
93
-
94
-
95
-
96
-
97
-
98
-
99
-
100
-
101
-
102
-
103
-
104
-
105
-
106
-
107
-
108
-
109
-
110
-
111
-
112
-
113
-
114
-
115
-
116
-
117
-
118
-
119
-
120
-
121
-
122
-
123
-
124
-
125
-
126
-
127
-
128
-
129
-
130
-
131
-
132
-
133
-
134
-
135
-
136
-
137
-
138
-
139
-
140
-
141
-
142
-
143
-
144
-
145
-
146
-
147
-
 148
148 -
 149
149 -
 150
150 -
 151
151 -
 152
152 -
 153
153 -
 154
154 -
 155
155 -
 156
156 -
 157
157 -
 158
158 -
 159
159 -
 160
160 -
 161
161 -
 162
162 -
 163
163 -
 164
164 -
 165
165 -
 166
166 -
 167
167 -
 168
168 -
169
-
170
-
171
-
172
-
173
-
174
-
175
-
176
-
177
-
178
-
179
-
180
-
181
-
182
-
183
-
184
-
185
-
186
-
187
-
188
-
189
-
190
-
191
-
192
-
193
-
194
-
195
-
196
 |
 |

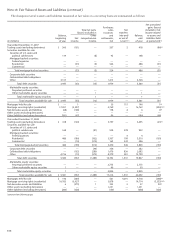
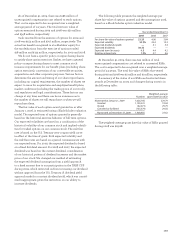
The changes in Level 3 assets and liabilities measured at fair value on a recurring basis are summarized as follows:
Net unrealized
Purchases, gains (losses)
Total net gains sales, Net included in net
(losses) included in issuances transfers income related
Balance, Other and into and/ Balance, to assets and
beginning Net comprehensive settlements, or out of end liabilities held
(in millions) of year income income net Level 3(1) of year at period end(2)
Year ended December 31, 2007
Trading assets (excluding derivatives) $ 360 (151) — 207 2 418 (86)(3)
Securities available for sale:
Securities of U.S. states and
political subdivisions 134 — (8) 42 — 168 —
Mortgage-backed securities:
Federal agencies — — — — — — —
Residential — (33) (5) 524 — 486 (31)
Commercial — — — — — — —
Total mortgage-backed securities — (33) (5) 524 — 486 (31)
Corporate debt securities — — — — — — —
Collateralized debt obligations — — — — — — —
Other 3,313 — — 1,413 — 4,726 —
Total debt securities 3,447 (33) (13) 1,979 — 5,380 (31)
Marketable equity securities:
Perpetual preferred securities — — — — — — —
Other marketable equity securities — — 1 — — 1 —
Total marketable equity securities — — 1 — — 1 —
Total securities available for sale $ 3,447 (33) (12) 1,979 — 5,381 (31)
Mortgages held for sale $ — 1 — 30 115 146 1(4)
Mortgage servicing rights (residential) 17,591 (3,597) — 2,769 — 16,763 (594)(4)(5)
Net derivative assets and liabilities (68) (108) — 178 4 6 6(4)
Other assets (excluding derivatives) — — — — — — —
Other liabilities (excluding derivatives) (282) (97) — 99 — (280) (98)
Year ended December 31, 2008
Trading assets (excluding derivatives) $ 418 (120) — 3,197 — 3,495 (23)(3)
Securities available for sale:
Securities of U.S. states and
political subdivisions 168 — (81) 538 278 903 —
Mortgage-backed securities:
Federal agencies — — — — 4 4 —
Residential 486 (180) (302) 3,307 199 3,510 (150)
Commercial — (10) (210) 163 343 286 —
Total mortgage-backed securities 486 (190) (512) 3,470 546 3,800 (150)
Corporate debt securities — — (44) 326 — 282 —
Collateralized debt obligations — (152) (280) 1,679 836 2,083 —
Other 4,726 (15) (572) 8,379 281 12,799 —
Total debt securities 5,380 (357) (1,489) 14,392 1,941 19,867 (150)
Marketable equity securities:
Perpetual preferred securities — — — 2,775 — 2,775 —
Other marketable equity securities 1 — — 49 — 50 —
Total marketable equity securities 1 — — 2,824 — 2,825 —
Total securities available for sale $ 5,381 (357) (1,489) 17,216 1,941 22,692 (150)
Mortgages held for sale $ 146 (280) — 561 4,291 4,718 (268)(4)
Mortgage servicing rights (residential) 16,763 (5,927) — 3,878 — 14,714 (3,333)(4)(5)
Net derivative assets and liabilities 6 (275) 1 303 2 37 93(4)
Other assets (excluding derivatives) — — — 1,231 — 1,231 —
Other liabilities (excluding derivatives) (280) (228) — (130) — (638) (228)
(continued on following page)
Note 16: Fair Values of Assets and Liabilities (continued)