Wells Fargo 2009 Annual Report Download - page 150
Download and view the complete annual report
Please find page 150 of the 2009 Wells Fargo annual report below. You can navigate through the pages in the report by either clicking on the pages listed below, or by using the keyword search tool below to find specific information within the annual report.-
 1
1 -
2
-
3
-
4
-
5
-
6
-
7
-
8
-
9
-
10
-
11
-
12
-
13
-
14
-
15
-
16
-
17
-
18
-
19
-
20
-
21
-
22
-
23
-
24
-
25
-
26
-
27
-
28
-
29
-
30
-
31
-
32
-
33
-
34
-
35
-
36
-
37
-
38
-
39
-
40
-
41
-
42
-
43
-
44
-
45
-
46
-
47
-
48
-
49
-
50
-
51
-
52
-
53
-
54
-
55
-
56
-
57
-
58
-
59
-
60
-
61
-
62
-
63
-
64
-
65
-
66
-
67
-
68
-
69
-
70
-
71
-
72
-
73
-
74
-
75
-
76
-
77
-
78
-
79
-
80
-
81
-
82
-
83
-
84
-
85
-
86
-
87
-
88
-
89
-
90
-
91
-
92
-
93
-
94
-
95
-
96
-
97
-
98
-
99
-
100
-
101
-
102
-
103
-
104
-
105
-
106
-
107
-
108
-
109
-
110
-
111
-
112
-
113
-
114
-
115
-
116
-
117
-
118
-
119
-
120
-
121
-
122
-
123
-
124
-
125
-
126
-
127
-
128
-
129
-
130
-
131
-
132
-
133
-
134
-
135
-
136
-
137
-
138
-
139
-
 140
140 -
 141
141 -
 142
142 -
 143
143 -
 144
144 -
 145
145 -
 146
146 -
 147
147 -
 148
148 -
 149
149 -
 150
150 -
 151
151 -
 152
152 -
 153
153 -
 154
154 -
 155
155 -
 156
156 -
 157
157 -
 158
158 -
 159
159 -
 160
160 -
161
-
162
-
163
-
164
-
165
-
166
-
167
-
168
-
169
-
170
-
171
-
172
-
173
-
174
-
175
-
176
-
177
-
178
-
179
-
180
-
181
-
182
-
183
-
184
-
185
-
186
-
187
-
188
-
189
-
190
-
191
-
192
-
193
-
194
-
195
-
196
 |
 |

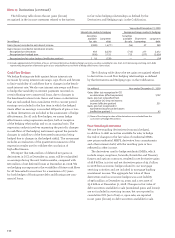
Year ended December 31, 2009
Interest rate contracts hedging Foreign exchange contracts hedging
Securities Securities
available Long-term available Short-term Long-term
(in millions) for sale debt for sale borrowings debt
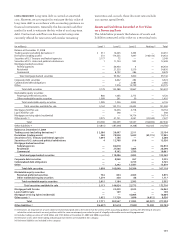
Gains (losses) recorded in net interest income $(289) 1,677(1) (56) 27 349
Gains (losses) recorded in noninterest income
Recognized on derivatives 954 (3,270) (713) 217 2,612
Recognized on hedged item (936) 3,132 713 (217) (2,626)
Recognized on fair value hedges (ineffective portion) $ 18 (138) — — (14)
(1) Includes approximately $10 million of losses on forward derivatives hedging foreign-currency securities available for sale, short-term borrowings and long-term debt,
representing the portion of derivative gain or loss excluded from assessment of hedge effectiveness (time value).
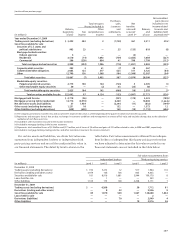
(in millions) Year ended December 31, 2009
Gains (after tax) recognized in OCI
on derivatives (effective portion) $107
Gains (pre tax) reclassified from
cumulative OCI into net interest
income (effective portion) 531
Gains (pre tax) recognized in
noninterest income on derivatives
(ineffective portion) (1) 42
(1) None of the change in value of the derivatives was excluded from the
assessment of hedge effectiveness.
The following table shows the net gains (losses)
recognized in the income statement related to derivatives
Note 15: Derivatives (continued)
in fair value hedging relationships as defined by the
Derivatives and Hedging topic in the Codification.
Cash Flow Hedges
We hedge floating-rate debt against future interest rate
increases by using interest rate swaps, caps, floors and futures
to limit variability of cash flows due to changes in the bench-
mark interest rate. We also use interest rate swaps and floors
to hedge the variability in interest payments received on
certain floating-rate commercial loans, due to changes in
the benchmark interest rate. Gains and losses on derivatives
that are reclassified from cumulative OCI to current period
earnings are included in the line item in which the hedged
item’s effect on earnings is recorded. All parts of gain or loss
on these derivatives are included in the assessment of hedge
effectiveness. For all cash flow hedges, we assess hedge
effectiveness using regression analysis, both at inception
of the hedging relationship and on an ongoing basis. The
regression analysis involves regressing the periodic changes
in cash flows of the hedging instrument against the periodic
changes in cash flows of the forecasted transaction being
hedged due to changes in the hedged risk(s). The assessment
includes an evaluation of the quantitative measures of the
regression results used to validate the conclusion of
high effectiveness.
We expect that $284 million of deferred net gains on
derivatives in OCI at December 31, 2009, will be reclassified
as earnings during the next twelve months, compared with
$60 million of net deferred losses at December 31, 2008. We
are hedging our exposure to the variability of future cash flows
for all forecasted transactions for a maximum of 17 years
for both hedges of floating-rate debt and floating-rate com-
mercial loans.
Free-Standing Derivatives
We use free-standing derivatives (economic hedges),
in addition to debt securities available for sale, to hedge
the risk of changes in the fair value of residential MSRs,
new prime residential MHFS, derivative loan commitments
and other interests held, with the resulting gain or loss
reflected in other income.
The derivatives used to hedge residential MSRs, which
include swaps, swaptions, forwards, Eurodollar and Treasury
futures and options contracts, resulted in net derivative gains
of $6.8 billion in 2009 and net derivative gains of $3.1 billion
in 2008 from economic hedges related to our mortgage
servicing activities and are included in mortgage banking
noninterest income. The aggregate fair value of these
derivatives used as economic hedges was a net liability
of $961 million at December 31, 2009, and a net asset of
$3.6 billion at December 31, 2008. Changes in fair value of
debt securities available for sale (unrealized gains and losses)
are not included in servicing income, but are reported in
cumulative OCI (net of tax) or, upon sale, are reported
in net gains (losses) on debt securities available for sale.
The following table shows the net gains recognized related
to derivatives in cash flow hedging relationships as defined
by the Derivatives and Hedging topic in the Codification.