Wells Fargo 2009 Annual Report Download - page 137
Download and view the complete annual report
Please find page 137 of the 2009 Wells Fargo annual report below. You can navigate through the pages in the report by either clicking on the pages listed below, or by using the keyword search tool below to find specific information within the annual report.-
 1
1 -
2
-
3
-
4
-
5
-
6
-
7
-
8
-
9
-
10
-
11
-
12
-
13
-
14
-
15
-
16
-
17
-
18
-
19
-
20
-
21
-
22
-
23
-
24
-
25
-
26
-
27
-
28
-
29
-
30
-
31
-
32
-
33
-
34
-
35
-
36
-
37
-
38
-
39
-
40
-
41
-
42
-
43
-
44
-
45
-
46
-
47
-
48
-
49
-
50
-
51
-
52
-
53
-
54
-
55
-
56
-
57
-
58
-
59
-
60
-
61
-
62
-
63
-
64
-
65
-
66
-
67
-
68
-
69
-
70
-
71
-
72
-
73
-
74
-
75
-
76
-
77
-
78
-
79
-
80
-
81
-
82
-
83
-
84
-
85
-
86
-
87
-
88
-
89
-
90
-
91
-
92
-
93
-
94
-
95
-
96
-
97
-
98
-
99
-
100
-
101
-
102
-
103
-
104
-
105
-
106
-
107
-
108
-
109
-
110
-
111
-
112
-
113
-
114
-
115
-
116
-
117
-
118
-
119
-
120
-
121
-
122
-
123
-
124
-
125
-
126
-
 127
127 -
 128
128 -
 129
129 -
 130
130 -
 131
131 -
 132
132 -
 133
133 -
 134
134 -
 135
135 -
 136
136 -
 137
137 -
 138
138 -
 139
139 -
 140
140 -
 141
141 -
 142
142 -
 143
143 -
 144
144 -
 145
145 -
 146
146 -
 147
147 -
148
-
149
-
150
-
151
-
152
-
153
-
154
-
155
-
156
-
157
-
158
-
159
-
160
-
161
-
162
-
163
-
164
-
165
-
166
-
167
-
168
-
169
-
170
-
171
-
172
-
173
-
174
-
175
-
176
-
177
-
178
-
179
-
180
-
181
-
182
-
183
-
184
-
185
-
186
-
187
-
188
-
189
-
190
-
191
-
192
-
193
-
194
-
195
-
196
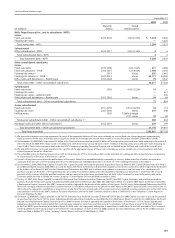
 |
 |

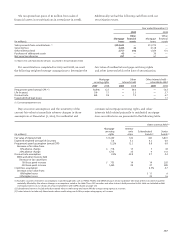
Year ended December 31,
(in millions) 2009 2008 2007
Servicing income, net:
Servicing fees $ 3,942 3,855 4,025
Changes in fair value of residential MSRs:
Due to changes in valuation model inputs or assumptions (1) (1,534) (3,341) (571)
Other changes in fair value (2) (3,436) (2,559) (3,026)
Total changes in fair value of residential MSRs (4,970) (5,900) (3,597)
Amortization (264) (75) (71)
Net derivative gains from economic hedges (3) 6,849 3,099 1,154
Total servicing income, net 5,557 979 1,511
Net gains on mortgage loan origination/sales activities 6,152 1,183 1,289
All other 319 363 333
Total mortgage banking noninterest income $12,028 2,525 3,133
Market-related valuation changes to MSRs, net of hedge results (1) + (3) $ 5,315 (242) 583
(1) Principally reflects changes in discount rates and prepayment speed assumptions, mostly due to changes in interest rates.
(2) Represents changes due to collection/realization of expected cash flows over time.
(3) Represents results from free-standing derivatives (economic hedges) used to hedge the risk of changes in fair value of MSRs. See Note 15 – Free-Standing Derivatives
in this Report for additional discussion and detail.
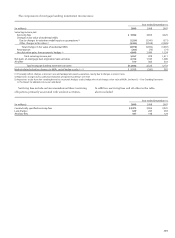
The components of mortgage banking noninterest income were:
Year ended December 31,
(in millions) 2009 2008 2007
Contractually specified servicing fees $4,473 3,904 3,922
Late charges 329 283 293
Ancillary fees 187 148 124
Servicing fees include certain unreimbursed direct servicing
obligations primarily associated with workout activities.
In addition, servicing fees and all other in the table
above included: