Wells Fargo 2009 Annual Report Download - page 56
Download and view the complete annual report
Please find page 56 of the 2009 Wells Fargo annual report below. You can navigate through the pages in the report by either clicking on the pages listed below, or by using the keyword search tool below to find specific information within the annual report.-
 1
1 -
2
-
3
-
4
-
5
-
6
-
7
-
8
-
9
-
10
-
11
-
12
-
13
-
14
-
15
-
16
-
17
-
18
-
19
-
20
-
21
-
22
-
23
-
24
-
25
-
26
-
27
-
28
-
29
-
30
-
31
-
32
-
33
-
34
-
35
-
36
-
37
-
38
-
39
-
40
-
41
-
42
-
43
-
44
-
45
-
 46
46 -
 47
47 -
 48
48 -
 49
49 -
 50
50 -
 51
51 -
 52
52 -
 53
53 -
 54
54 -
 55
55 -
 56
56 -
 57
57 -
 58
58 -
 59
59 -
 60
60 -
 61
61 -
 62
62 -
 63
63 -
 64
64 -
 65
65 -
 66
66 -
67
-
68
-
69
-
70
-
71
-
72
-
73
-
74
-
75
-
76
-
77
-
78
-
79
-
80
-
81
-
82
-
83
-
84
-
85
-
86
-
87
-
88
-
89
-
90
-
91
-
92
-
93
-
94
-
95
-
96
-
97
-
98
-
99
-
100
-
101
-
102
-
103
-
104
-
105
-
106
-
107
-
108
-
109
-
110
-
111
-
112
-
113
-
114
-
115
-
116
-
117
-
118
-
119
-
120
-
121
-
122
-
123
-
124
-
125
-
126
-
127
-
128
-
129
-
130
-
131
-
132
-
133
-
134
-
135
-
136
-
137
-
138
-
139
-
140
-
141
-
142
-
143
-
144
-
145
-
146
-
147
-
148
-
149
-
150
-
151
-
152
-
153
-
154
-
155
-
156
-
157
-
158
-
159
-
160
-
161
-
162
-
163
-
164
-
165
-
166
-
167
-
168
-
169
-
170
-
171
-
172
-
173
-
174
-
175
-
176
-
177
-
178
-
179
-
180
-
181
-
182
-
183
-
184
-
185
-
186
-
187
-
188
-
189
-
190
-
191
-
192
-
193
-
194
-
195
-
196
 |
 |

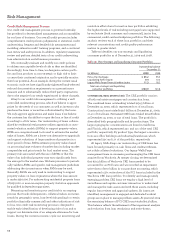
Credit Risk Management Process
Our credit risk management process is governed centrally,
but provides for decentralized management and accountability
by our lines of business. Our overall credit process includes
comprehensive credit policies, judgmental or statistical credit
underwriting, frequent and detailed risk measurement and
modeling, extensive credit training programs, and a continual
loan review and audit process. In addition, regulatory examiners
review and perform detailed tests of our credit underwriting,
loan administration and allowance processes.
We continually evaluate and modify our credit policies
to address unacceptable levels of risk as they are identified.
Accordingly, from time to time, we designate certain portfo-
lios and loan products as non-strategic or high risk to limit
or cease their continued origination and to specially monitor
their loss potential. As an example, during the current weak
economic cycle we have significantly tightened bank-selected
reduced documentation requirements as a precautionary
measure and to substantially reduce third party originations
due to the negative loss trends experienced in these channels.
A key to our credit risk management is utilizing a well
controlled underwriting process, which we believe is appro-
priate for the needs of our customers as well as investors who
purchase the loans or securities collateralized by the loans.
We only approve applications and make loans if we believe
the customer has the ability to repay the loan or line of credit
according to all its terms. Our underwriting of loans collater-
alized by residential real property utilizes appraisals or auto-
mated valuation models (AVMs) to support property values.
AVMs are computer-based tools used to estimate the market
value of homes. AVMs are a lower-cost alternative to appraisals
and support valuations of large numbers of properties in a
short period of time. AVMs estimate property values based
on processing large volumes of market data including market
comparables and price trends for local market areas. The
primary risk associated with the use of AVMs is that the
value of an individual property may vary significantly from
the average for the market area. We have processes to periodi-
cally validate AVMs and specific risk management guidelines
addressing the circumstances when AVMs may be used.
Generally, AVMs are only used in underwriting to support
property values on loan originations where the loan amount
is under $250,000. For underwriting residential property loans
of $250,000 or more we require property visitation appraisals
by qualified independent appraisers.
Measuring and monitoring our credit risk is an ongoing
process that tracks delinquencies, collateral values, economic
trends by geographic areas, loan-level risk grading for certain
portfolios (typically commercial) and other indications of risk
to loss. Our credit risk monitoring process is designed to
enable early identification of developing risk to loss and to
support our determination of an adequate allowance for loan
losses. During the current economic cycle our monitoring and
resolution efforts have focused on loan portfolios exhibiting
the highest levels of risk including mortgage loans supported
by real estate (both consumer and commercial), junior lien,
commercial, credit card and subprime portfolios. The following
analysis reviews each of these loan portfolios and their
relevant concentrations and credit quality performance
metrics in greater detail.
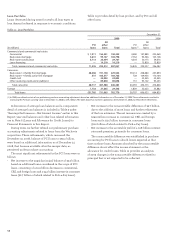
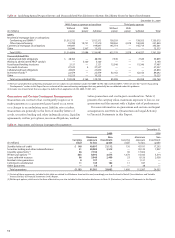
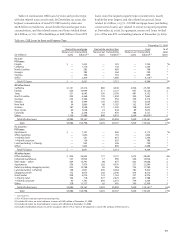
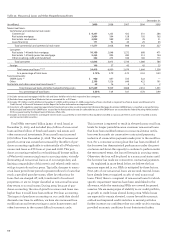
Table 19 identifies our non-strategic and liquidating
consumer portfolios as of December 31, 2009 and 2008.
Risk Management
Table 19: Non-Strategic and Liquidating Consumer Portfolios
Outstanding balance
December 31,
(in billions) 2009 2008
Pick-a-Pay mortgage $ 85.2 95.3
Liquidating home equity 8.4 10.3
Legacy Wells Fargo Financial indirect auto 11.3 18.2
Total non-strategic and liquidating
consumer portfolios $104.9 123.8
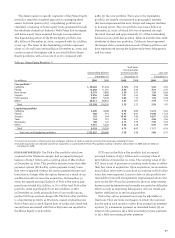
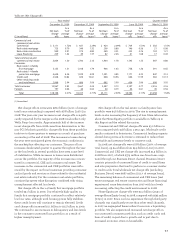
COMMERCIAL REAL ESTATE (CRE) The CRE portfolio consists
of both real estate mortgages and construction loans.
The combined loans outstanding totaled $134.5 billion at
December 31, 2009, which represented 17% of total loans.
Construction loans totaled $29.7 billion at December 31, 2009,
or 4% of total loans. Permanent CRE loans totaled $104.8 billion
at December 31, 2009, or 13% of total loans. The portfolio is
diversified both geographically and by product type. The
largest geographic concentrations are found in California
and Florida, which represented 22% and 11% of the total CRE
portfolio, respectively. By product type, the largest concentra-
tions are office buildings and industrial/warehouse, which
represented 23% and 11% of the portfolio, respectively.
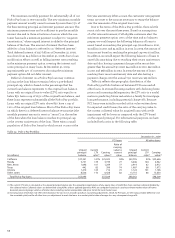
At legacy Wells Fargo our underwriting of CRE loans has
been focused primarily on cash flows and creditworthiness,
not solely collateral valuations. Our legacy Wells Fargo
management team is overseeing and managing the CRE loans
acquired from Wachovia. At merger closing, we determined
that $19.3 billion of Wachovia CRE loans needed to be
accounted for as PCI loans and we recorded an impairment
write-down of $7.0 billion in our purchase accounting, which
represented a 37% write-down of the PCI loans included in the
Wachovia CRE loan portfolio. To identify and manage newly
emerging problem CRE loans we employ a high level of
surveillance and regular customer interaction to understand
and manage the risks associated with these assets, including
regular loan reviews and appraisal updates. As issues are
identified, management is engaged and dedicated workout
groups are in place to manage problem assets. At year-end 2009
the remaining balance of PCI CRE loans totaled $9.3 billion.
This balance reflects the refinement of the impairment analysis
and reduction from loan resolutions and write-downs.