Wells Fargo 2009 Annual Report Download - page 115
Download and view the complete annual report
Please find page 115 of the 2009 Wells Fargo annual report below. You can navigate through the pages in the report by either clicking on the pages listed below, or by using the keyword search tool below to find specific information within the annual report.-
 1
1 -
2
-
3
-
4
-
5
-
6
-
7
-
8
-
9
-
10
-
11
-
12
-
13
-
14
-
15
-
16
-
17
-
18
-
19
-
20
-
21
-
22
-
23
-
24
-
25
-
26
-
27
-
28
-
29
-
30
-
31
-
32
-
33
-
34
-
35
-
36
-
37
-
38
-
39
-
40
-
41
-
42
-
43
-
44
-
45
-
46
-
47
-
48
-
49
-
50
-
51
-
52
-
53
-
54
-
55
-
56
-
57
-
58
-
59
-
60
-
61
-
62
-
63
-
64
-
65
-
66
-
67
-
68
-
69
-
70
-
71
-
72
-
73
-
74
-
75
-
76
-
77
-
78
-
79
-
80
-
81
-
82
-
83
-
84
-
85
-
86
-
87
-
88
-
89
-
90
-
91
-
92
-
93
-
94
-
95
-
96
-
97
-
98
-
99
-
100
-
101
-
102
-
103
-
104
-
 105
105 -
 106
106 -
 107
107 -
 108
108 -
 109
109 -
 110
110 -
 111
111 -
 112
112 -
 113
113 -
 114
114 -
 115
115 -
 116
116 -
 117
117 -
 118
118 -
 119
119 -
 120
120 -
 121
121 -
 122
122 -
 123
123 -
 124
124 -
 125
125 -
126
-
127
-
128
-
129
-
130
-
131
-
132
-
133
-
134
-
135
-
136
-
137
-
138
-
139
-
140
-
141
-
142
-
143
-
144
-
145
-
146
-
147
-
148
-
149
-
150
-
151
-
152
-
153
-
154
-
155
-
156
-
157
-
158
-
159
-
160
-
161
-
162
-
163
-
164
-
165
-
166
-
167
-
168
-
169
-
170
-
171
-
172
-
173
-
174
-
175
-
176
-
177
-
178
-
179
-
180
-
181
-
182
-
183
-
184
-
185
-
186
-
187
-
188
-
189
-
190
-
191
-
192
-
193
-
194
-
195
-
196
 |
 |
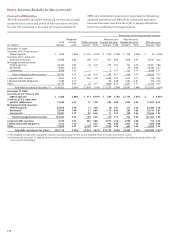
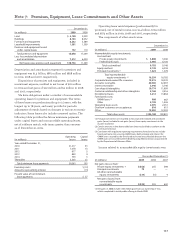
We do not have the intent to sell any securities included
in the table above. For debt securities included in the table
above, we have concluded it is more likely than not that we
will not be required to sell prior to recovery of the amortized
cost basis. We have assessed each security for credit impair-
ment. For debt securities, we evaluate, where necessary,
whether credit impairment exists by comparing the present
value of the expected cash flows to the securities amortized
cost basis. For equity securities, we consider numerous fac-
tors in determining whether impairment exists, including
our intent and ability to hold the securities for a period of
time sufficient to recover the cost basis of the securities.
See Note 1 – “Securities” in this Report for the factors
that we consider in our analysis of OTTI for debt and equity
securities available for sale.
SECURITIES OF U.S. TREASURY AND FEDERAL AGENCIES The
unrealized losses associated with U.S. Treasury and federal
agency securities do not have any credit losses due to the
guarantees provided by the United States government.
SECURITIES OF U.S. STATES AND POLITICAL SUBDIVISIONS The
unrealized losses associated with securities of U.S. states
and political subdivisions are primarily driven by changes
in interest rates and not due to the credit quality of the securi-
ties. The fair value of these investments is almost exclusively
investment grade. The securities were generally underwritten
in accordance with our own investment standards prior to
the decision to purchase, without relying on a bond insurer’s
guarantee in making the investment decision. These invest-
ments will continue to be monitored as part of our ongoing
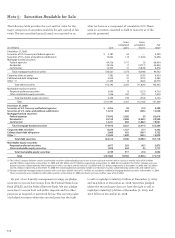
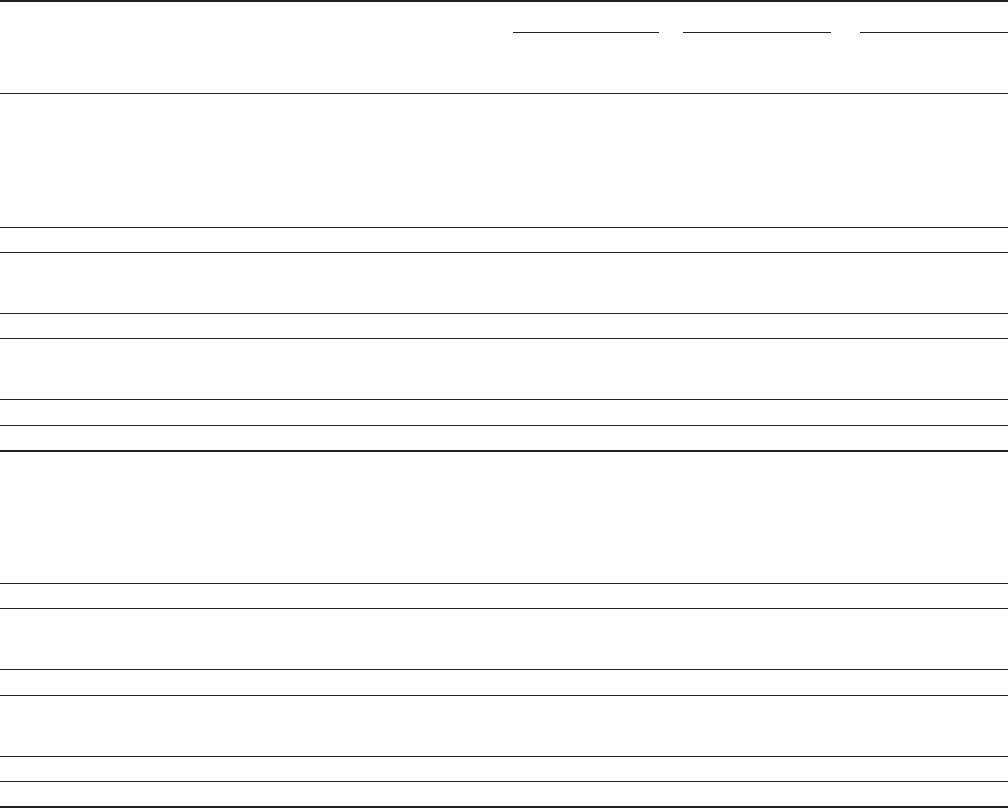
Less than 12 months 12 months or more Total
Gross Gross Gross
unrealized Fair unrealized Fair unrealized Fair
(in millions) losses value losses value losses value
December 31, 2008
Securities of U.S. Treasury and federal agencies $ — — — — — —
Securities of U.S. states and political subdivisions (745) 3,483 (775) 1,702 (1,520) 5,185
Mortgage-backed securities:
Federal agencies (3) 83 — — (3) 83
Residential (4,471) 9,960 (246) 238 (4,717) 10,198
Commercial (1,726) 4,152 (2,152) 2,302 (3,878) 6,454
Total mortgage-backed securities (6,200) 14,195 (2,398) 2,540 (8,598) 16,735
Corporate debt securities (285) 1,056 (254) 469 (539) 1,525
Collateralized debt obligations (113) 215 (457) 180 (570) 395
Other (554) 8,638 (48) 38 (602) 8,676
Total debt securities (7,897) 27,587 (3,932) 4,929 (11,829) 32,516
Marketable equity securities:
Perpetual preferred securities (75) 265 (252) 360 (327) 625
Other marketable equity securities (23) 72 (4) 9 (27) 81
Total marketable equity securities (98) 337 (256) 369 (354) 706
Total $(7,995) 27,924 (4,188) 5,298 (12,183) 33,222
December 31, 2009
Securities of U.S. Treasury and federal agencies $ (14) 530 — — (14) 530
Securities of U.S. states and political subdivisions (55) 1,120 (310) 2,826 (365) 3,946
Mortgage-backed securities:
Federal agencies (9) 767 — — (9) 767
Residential (243) 2,991 (1,800) 9,697 (2,043) 12,688
Commercial (37) 816 (1,825) 6,370 (1,862) 7,186
Total mortgage-backed securities (289) 4,574 (3,625) 16,067 (3,914) 20,641
Corporate debt securities (7) 281 (70) 442 (77) 723
Collateralized debt obligations (55) 398 (312) 512 (367) 910
Other (73) 746 (172) 286 (245) 1,032
Total debt securities (493) 7,649 (4,489) 20,133 (4,982) 27,782
Marketable equity securities:
Perpetual preferred securities (1) 93 (64) 527 (65) 620
Other marketable equity securities (9) 175 — — (9) 175
Total marketable equity securities (10) 268 (64) 527 (74) 795
Total $ (503) 7,917 (4,553) 20,660 (5,056) 28,577
Gross Unrealized Losses and Fair Value
The following table shows the gross unrealized losses and fair
value of securities in the securities available for sale portfolio
by length of time that individual securities in each category
had been in a continuous loss position. Debt securities on
which we have taken only credit-related OTTI write-downs
are categorized as being “less than 12 months” or “12 months
or more” in a continuous loss position based on the point
in time that the fair value declined to below the cost basis
and not the period of time since the credit-related
OTTI write-down.