Wells Fargo 2009 Annual Report Download - page 179
Download and view the complete annual report
Please find page 179 of the 2009 Wells Fargo annual report below. You can navigate through the pages in the report by either clicking on the pages listed below, or by using the keyword search tool below to find specific information within the annual report.-
 1
1 -
2
-
3
-
4
-
5
-
6
-
7
-
8
-
9
-
10
-
11
-
12
-
13
-
14
-
15
-
16
-
17
-
18
-
19
-
20
-
21
-
22
-
23
-
24
-
25
-
26
-
27
-
28
-
29
-
30
-
31
-
32
-
33
-
34
-
35
-
36
-
37
-
38
-
39
-
40
-
41
-
42
-
43
-
44
-
45
-
46
-
47
-
48
-
49
-
50
-
51
-
52
-
53
-
54
-
55
-
56
-
57
-
58
-
59
-
60
-
61
-
62
-
63
-
64
-
65
-
66
-
67
-
68
-
69
-
70
-
71
-
72
-
73
-
74
-
75
-
76
-
77
-
78
-
79
-
80
-
81
-
82
-
83
-
84
-
85
-
86
-
87
-
88
-
89
-
90
-
91
-
92
-
93
-
94
-
95
-
96
-
97
-
98
-
99
-
100
-
101
-
102
-
103
-
104
-
105
-
106
-
107
-
108
-
109
-
110
-
111
-
112
-
113
-
114
-
115
-
116
-
117
-
118
-
119
-
120
-
121
-
122
-
123
-
124
-
125
-
126
-
127
-
128
-
129
-
130
-
131
-
132
-
133
-
134
-
135
-
136
-
137
-
138
-
139
-
140
-
141
-
142
-
143
-
144
-
145
-
146
-
147
-
148
-
149
-
150
-
151
-
152
-
153
-
154
-
155
-
156
-
157
-
158
-
159
-
160
-
161
-
162
-
163
-
164
-
165
-
166
-
167
-
168
-
 169
169 -
 170
170 -
 171
171 -
 172
172 -
 173
173 -
 174
174 -
 175
175 -
 176
176 -
 177
177 -
 178
178 -
 179
179 -
 180
180 -
 181
181 -
 182
182 -
 183
183 -
 184
184 -
 185
185 -
 186
186 -
 187
187 -
 188
188 -
 189
189 -
190
-
191
-
192
-
193
-
194
-
195
-
196
 |
 |

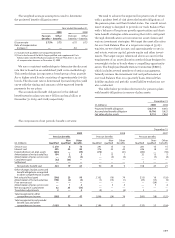
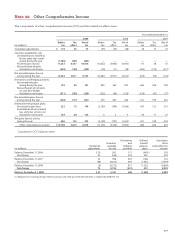
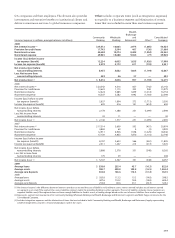
Year ended December 31,
2009 2008 2007
Before Tax Net of Before Tax Net of Before Tax Net of
(in millions) tax effect tax tax effect tax tax effect tax
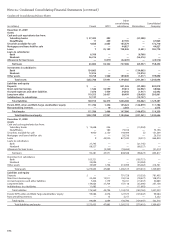
Translation adjustments $ 118 45 73 (93) (35) (58) 36 13 23
Securities available for sale:
Unrealized losses related to
factors other than credit
arising during the year (1,340) (497) (843) ——— ———
All other gains (losses) 17,253 6,437 10,816 (10,552) (3,960) (6,592) 91 38 53
Reclassification of gains
included in net income (349) (129) (220) (29) (11) (18) (350) (133) (217)
Net unrealized gains (losses)
arising during the year 15,564 5,811 9,753 (10,581) (3,971) (6,610) (259) (95) (164)
Derivatives and hedging activities:
Net unrealized gains
arising during the year 193 86 107 955 363 592 645 246 399
Reclassification of net gains
on cash flow hedges
included in net income (531) (203) (328) (252) (96) (156) (124) (47) (77)
Net unrealized gains (losses)
arising during the year (338) (117) (221) 703 267 436 521 199 322
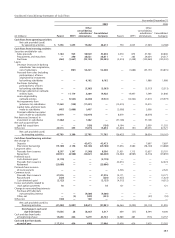
Defined benefit pension plans:
Net actuarial gain (loss) 222 73 149 (2,165) (799) (1,366) 347 132 215
Amortization of net actuarial
loss and prior service cost
included in net income 184 60 124 6 2 4 44 17 27
Net gains (losses) arising
during the year 406 133 273 (2,159) (797) (1,362) 391 149 242
Other comprehensive income $15,750 5,872 9,878 (12,130) (4,536) (7,594) 689 266 423
Note 22: Other Comprehensive Income
The components of other comprehensive income (OCI) and the related tax effects were:
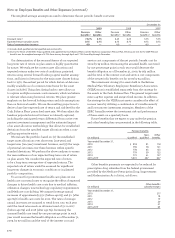
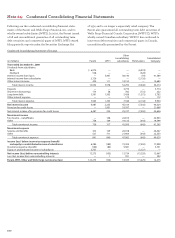
Cumulative OCI balances were:
Derivatives Defined Cumulative
Securities and benefit other
Translation available hedging pension comprehensive
(in millions) adjustments for sale activities plans income
Balance, December 31, 2006 $ 29 562 113 (402)(1) 302
Net change 23 (164) 322 242 423
Balance, December 31, 2007 52 398 435 (160) 725
Net change (58) (6,610) 436 (1,362) (7,594)
Balance, December 31, 2008 (6) (6,212) 871 (1,522) (6,869)
Net change 73 9,753 (221) 273 9,878
Balance, December 31, 2009 $ 67 3,541 650 (1,249) 3,009
(1) Adoption of accounting change related to pension and other postretirement benefits as required by FASB ASC 715.